
Figure 3.
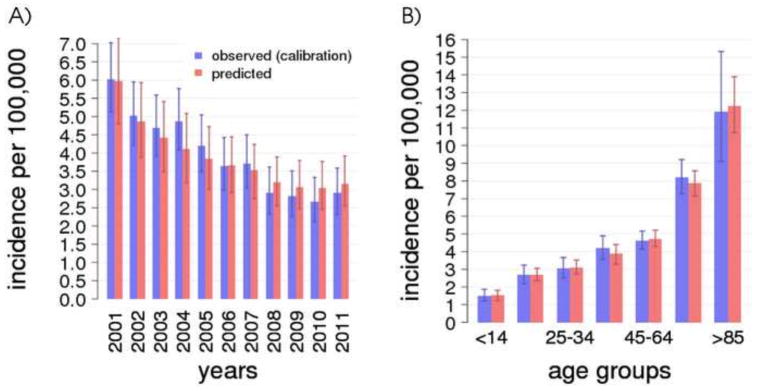
A) TB incidence over time (2001–2011) in Arkansas comparing model and data. B) TB incidence by age groups in Arkansas, average 2001–2011. For both panels, error bars for the data are calculated as the 95-percentile confidence interval of a binomial distribution with size equal to the age-group specific Arkansas population at each time point and probability equal to the observed incidence. Average and 95-percentile error bars for the model are calculated over 100 best parameter sets and 100 stochastic simulations of the model.