
Figure 5.
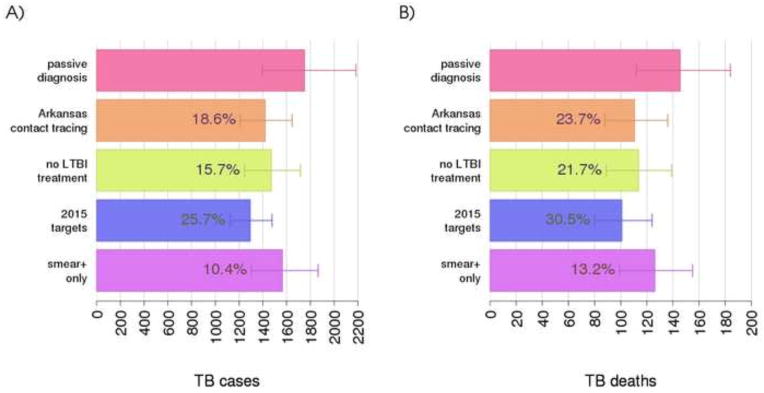
Impact of contact investigation programs on TB cases (A) and TB deaths (B). Numbers within bars indicate the average percentage of avoided TB cases and deaths with respect to a passive diagnosis program. An expanded description of each program is reported at the end of section Methods. Average and 95-percentile error bars for the model are calculated over 100 best parameter sets and 100 stochastic simulations of the model.