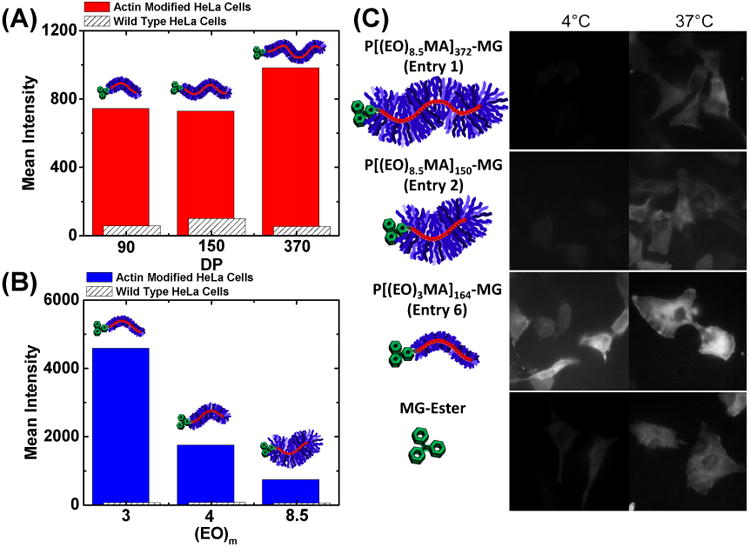
Figure 4.

Polymeric probe internalization via flow cytometry and fluorescence microscopy. All cells were incubated in DMEM + 10% fetal bovine serum (FBS) containing 500 nM polymeric dye for 12 hours. (A) Mean fluorescent intensity as a function of polymer backbone DP with all polymers having EO side chain lengths of ∼8.5 (Table 1, Entries 1-3). Red bars correspond to FAP-actin modified HeLa cells, whereas white bars with black hashes correspond to control wild-type HeLa cells. (B) Mean fluorescent intensity as a function of varying EO side-chain length (integer corresponds to the number of EO repeat units) with all polymers having backbone DPs ≈ 150-170 (Table 1, Entries 2, 5-6). Red and blue bars correspond to FAP-actin modified HeLa cells, whereas white bars with black hashes correspond to control wild-type HeLa cells. A red laser was used to excite MG at 635 nm and emissions of MG bound to FAP were recorded between 650-710 nm. (C) Confocal images of FAP-actin modified HeLa cells incubated with 500nM P[(EO)mMA]n-MG and MG ester in DMEM + 10% FBS at 4°C and 37°C for 6 hours. The scale bar in confocal images represents 20 μm.
