
Figure 2.
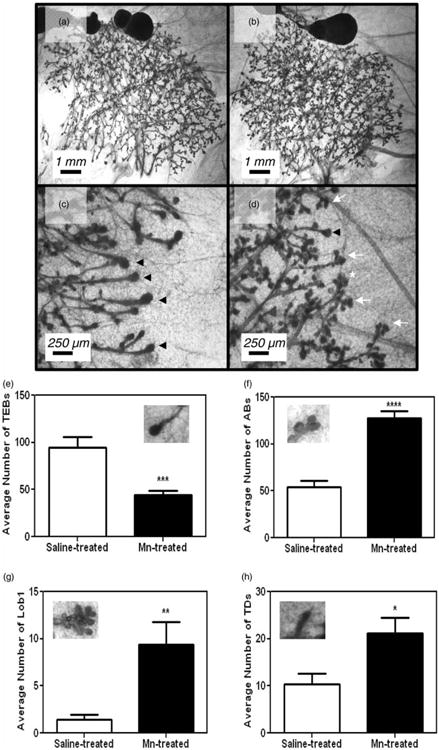
Mn exposure increases MG differentiation at PND 30. Representative images of abdominal mammary gland #4 taken from rats dosed from PND 12 until PND 29 with either 0.9% saline solution (a and c) or 10 mg/kg MnCl2 (b and d). Note the increased expression of TEBs in controls (c) compared to increases in the differentiated gland structures: ABs and Lob1s in Mn-treated glands (d). (e) Mn exposure resulted in a significant decrease in the mean (±SEM) number of TEBs compared to saline controls at PND 30. (f) to (h) The mean (±SEM) number of differentiated terminal MG structures: ABs, Lob1, and TDs, respectively, was all increased in the Mn-treated versus saline control animals at PND 30. Bars represent an N of 7 (saline) and N of 8 (Mn) animals per group. Representative image of MG structures within graphs. AB: alveolar bud; Lob1: lobular type 1; PND: postnatal day; TD: terminal duct; TEB: terminal end bud; ABs = white arrow heads; Lobs = white asterisk; TEBs = black arrow heads. * = p <0.05; ** = p <0.01; *** = p < 0.001; **** = p < 0.0001