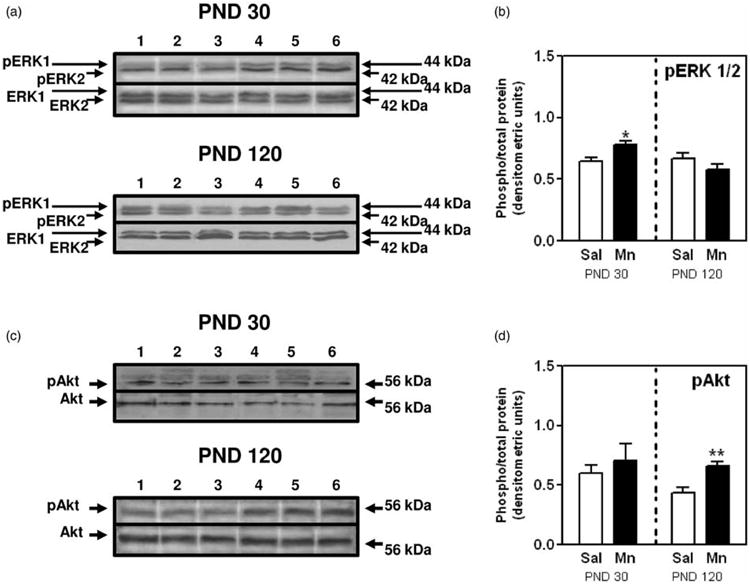
Figure 4.

Effects of Mn on MG protein phosphorylation of ERK1/2 and Akt. (a) Representative immunoblot illustrating the protein expression levels of phosphorylated ERK1/2 (pERK 1 and pERK 2) and ERK (ERK 1 and ERK 2) in MGs from saline (lanes 1–3) and Mn-treated (lanes 4–6) animals at PND 30 (top) and 120 (bottom). (b) Bar graph depicting the changes in the mean (±SEM) protein expression of pERK1/2 relative to ERK1/2 expression in MGsfrom Mn-treated animals at PND 30 and 120. (c) Representative immunoblot illustrating the protein expression levels of phosphorylated Akt (pAkt) and Akt (Akt) in MGs from saline (lanes 1–3) and Mn-treated (lanes 4–6) animals at PND 30 (top) and 120 (bottom). (d) Bar graph showing the mean (±SEM) protein expression of pAkt relative to Akt expression in MGs from Mn-treated animals at PND 30 and 120. Bars represent an N of 4-5 (PND 30) and 7 (PND 120) animals per group. * = p < 0.05; ** = p < 0.01
