
Figure 5.
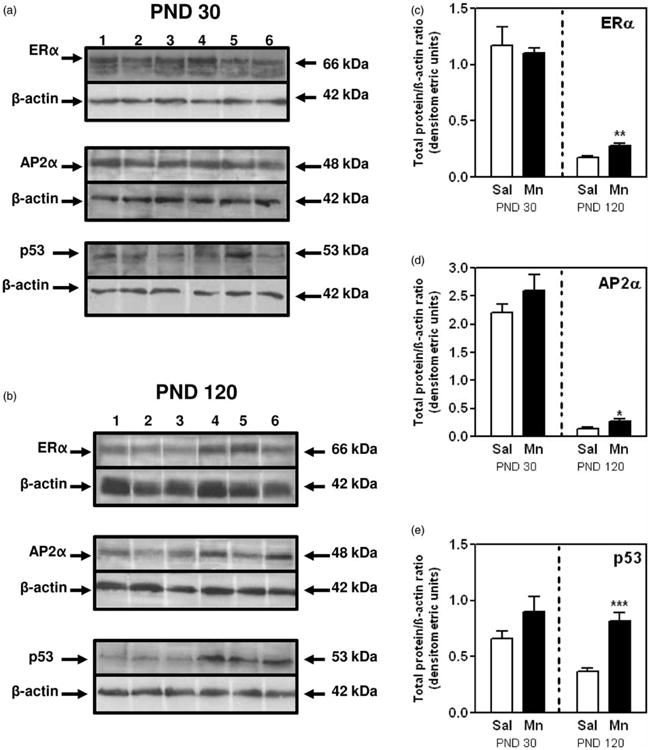
Effects of Mn on MG protein expression of ERa, AP2a, and p53 at PND30 and 120. (a) Representative immunoblots showing expression of ERα, AP2α, and p53 proteins in MGs from saline (lanes 1–3) and Mn-treated (lanes 4–6) rats at PNDs 30. (b) Representative immunoblots showing expression of ERα, AP2α, and p53 proteins in MGs from saline (lanes 1–3) and Mn-treated (lanes 4–6) rats at PNDs 120. (c) Depicts the quantitation of mean (±SEM) ERα protein levels in MGs from all animals at PNDs 30 and 120. (d) Depicts the quantitation of mean (±SEM) AP2α protein levels in MGs from all animals at PNDs 30 and 120. (e) Depicts the quantitation of mean (±SEM) p53 protein levels in MGs from all animals at PNDs 30 and 120. Bars represent an N of 4–5 (PND 30) and 6–7 (PND 120) animals per group. * = p < 0.05; ** = p < 0.01;*** = p < 0.001