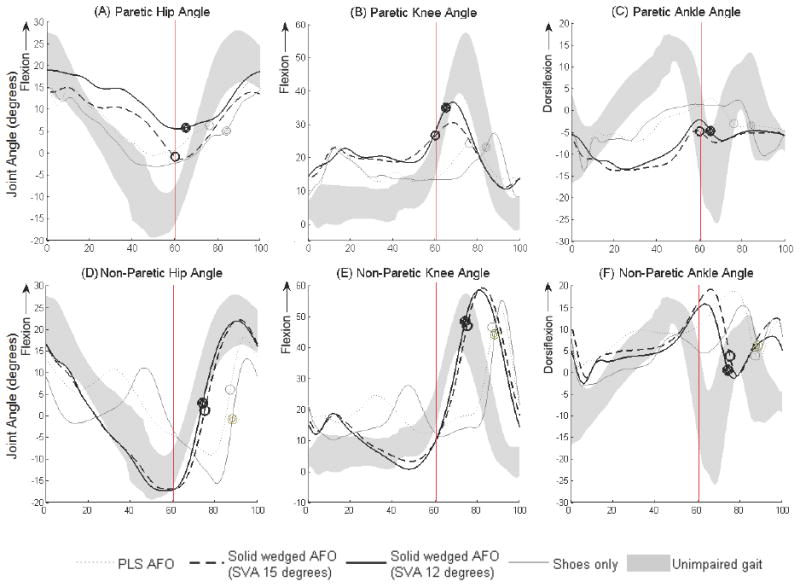
Figure 2.

Average sagittal plane kinematics at the hip, knee, and ankle of the non-paretic and paretic sides with shoes alone (solid gray lines), PLS AFO (dotted gray lines), AFO-FC with 15° SVA (dotted black line) and AFO-FC with 12° SVA (solid black lines) normalized to one gait cycle. The gray shaded band depicts the average ± one standard deviation of unimpaired gait at very slow speeds. Circles and vertical lines indicate toe-off for each condition for the subject with stroke and unimpaired individuals, respectively. Positive values of hip and knee angles are flexion and positive values of ankle angle are dorsiflexion.
