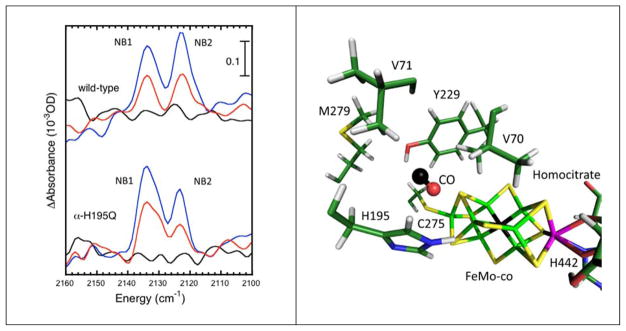
Figure 1.

Left: ‘free CO’ IR bands in wild-type N2ase44
vs. H195Q N2ase. Curves represent photolysis difference (subtracting with a no photolysis background) spectra: baseline noise before photolysis (—), halfway through photolysis (
 ), and endpoint of photolysis (
 ). Right: a model for CO in the docking site in one of the two orientations that could give rise to the observed splitting.
