
Fig. 4.
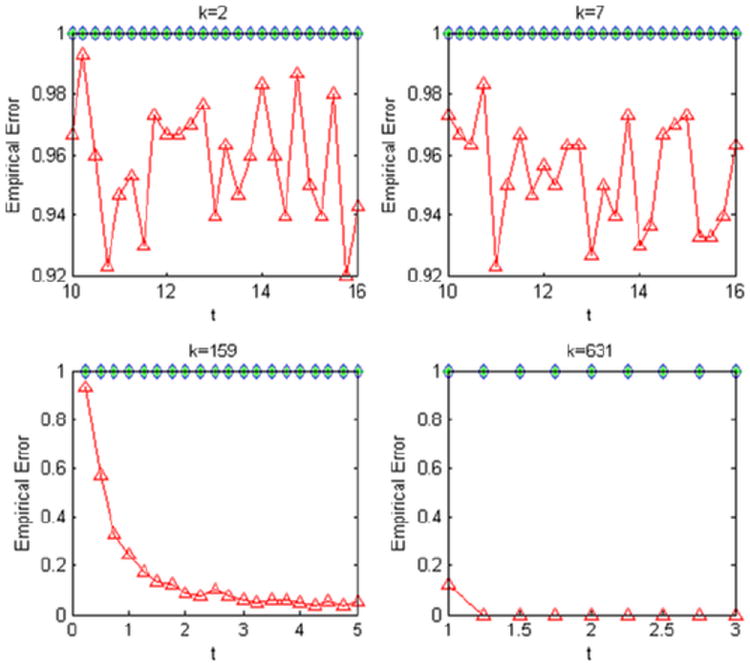
Simulation results are for p = 10,000 and . Sparsity level k is indicated below each plot. In each plot, the empirical risk of each method [GLRT (triangles); Higher Criticism (diamonds); Max Test (stars)] is plotted against t which corresponds to .