
Table 1. Demographic characteristics.
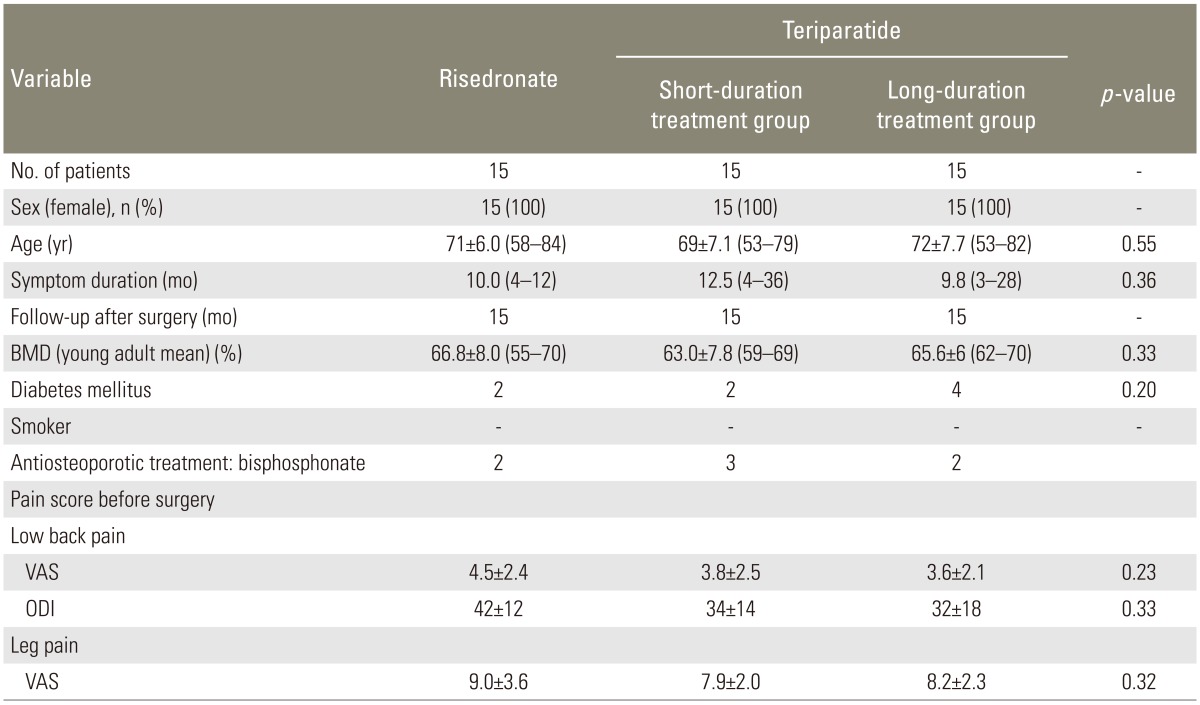
Values are presented as mean±standard deviation (range) unless otherwise indicated.
A p<0.05 was considered statistically significant.
BMD, bone mineral density; VAS, visual analogue scale; ODI, Oswestry disability index.