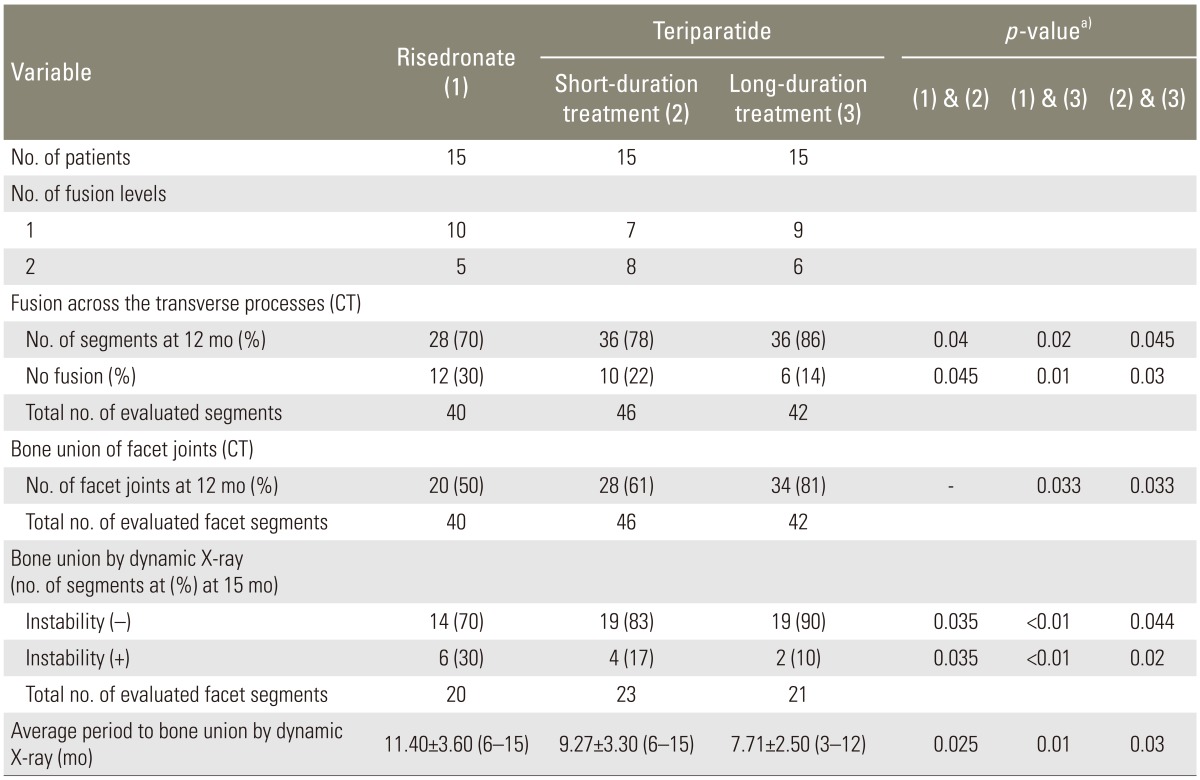
Table 2. Number of fusion levels and evaluation of bone union.

Values are presented as number (%) or mean±SD (range).
CT, computed tomography; SD, standard deviation.
a)A p<0.05 was considered statistically significant. The p-values represent the differences between groups.
