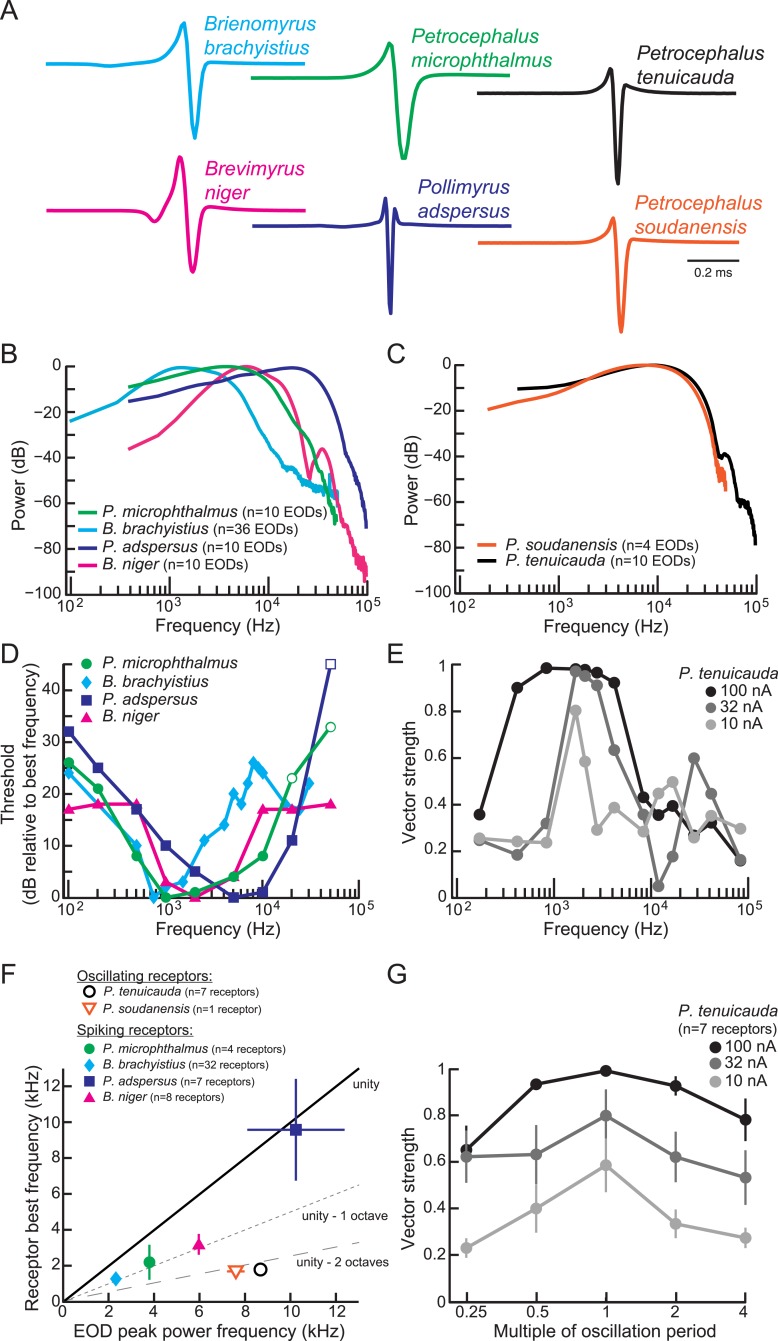
Figure 4. Frequency sensitivity of spiking receptors is matched to conspecific EOD power spectra, whereas frequency sensitivity of oscillating receptors is not.
(A) Representative EODs from four species with spiking receptors (Brienomyrus brachyistius, P. microphthalmus, Brevimyrus niger, and Pollimyrus adspersus), and two species with oscillating receptors (P. tenuicauda and P. soudanensis), plotted head-positive up with normalized peak-to-peak heights. (B, C) Average power spectra of EODs from species with spiking receptors (B) and from species with oscillating receptors (C). (D) Frequency tuning curves for representative spiking receptors from four species. Threshold was determined as the lowest intensity stimulus that elicited a spiking response. The frequency with the lowest threshold was taken as the receptor's best frequency. Thresholds were defined as dB relative to the threshold at each receptor's best frequency. Open symbols indicate stimuli for which there was no response from the receptor at the intensity shown, but responses to higher intensities were not recorded. (E) Frequency tuning curves for a representative oscillating receptor from P. tenuicauda at three intensities. Stimuli were single-cycle bipolar sine waves with positive polarity (peak preceding trough). Vector strength was used as a measure of phase-locking across responses. Vector strength equals 1 when the phase of the oscillatory reset is the same for each stimulus presentation and 0 when the phase of oscillatory reset is completely random for each stimulus presentation. The frequency that elicited the highest vector strength was taken as each receptor's best frequency. (F) Average receptor best frequency vs average conspecific EOD peak power frequency for all species studied. Best frequencies were averaged across responses to positive- and negative- (trough preceding peak) polarity stimuli in oscillating receptors. We used the best frequencies at 10 nA in P. tenuicauda. Closed symbols denote species with spiking receptors and open symbols denote species with oscillating receptors. (G) Vector strength of oscillating responses to positive-polarity single-cycle bipolar sine stimuli at multiples of receptors' spontaneous oscillation periods at three intensities in P. tenuicauda. Each point in F and G represents the average across receptors where appropriate, and error bars represent S.E.M.

