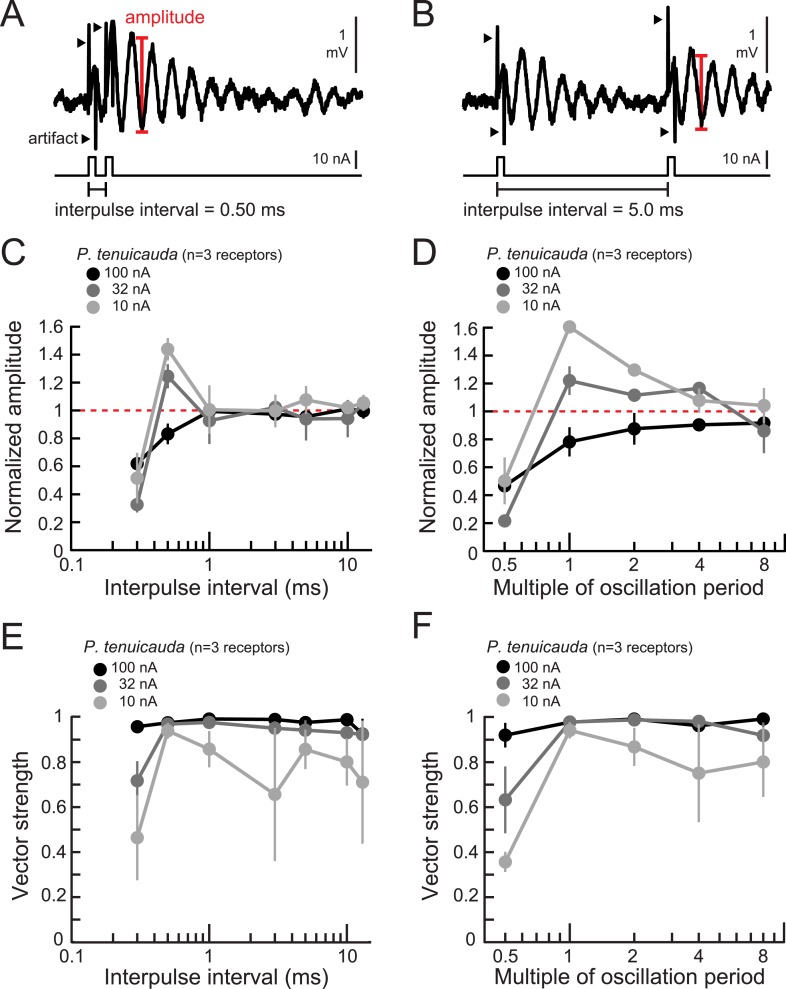
Figure 7. Oscillating receptors produce enhanced oscillation amplitudes at submillisecond IPIs matching their intrinsic oscillation periods.
(A, B) Extracellular recording from an oscillating receptor in P. tenuicauda in response to a pair of monopolar square pulses of 0.2-ms duration and 0.50-ms IPI (A) and 5.0-ms IPI (B). We measured the oscillation amplitude on each stimulus presentation as the mean voltage of the first two poststimulus oscillatory peaks minus the voltage at the intervening trough. We then averaged amplitudes across all presentations of the same stimulus. (C) Oscillation amplitude evoked by the second pulse in the pair normalized to the amplitude evoked by a single pulse vs IPI for the responses of P. tenuicauda receptors at three stimulus intensities. Data shown are for positive-polarity pulses. (D) Same as C for IPIs corresponding to multiples of oscillating receptors' intrinsic oscillation periods. (E) Vector strength vs IPI for oscillating responses to positive-polarity stimuli at three intensities in the same receptors shown in C and D. (F) Same as E for IPIs corresponding to multiples of oscillating receptors' intrinsic oscillation periods for the same receptors shown in C–E. Each point in C–F represents the mean across receptors and error bars represent S.E.M.

