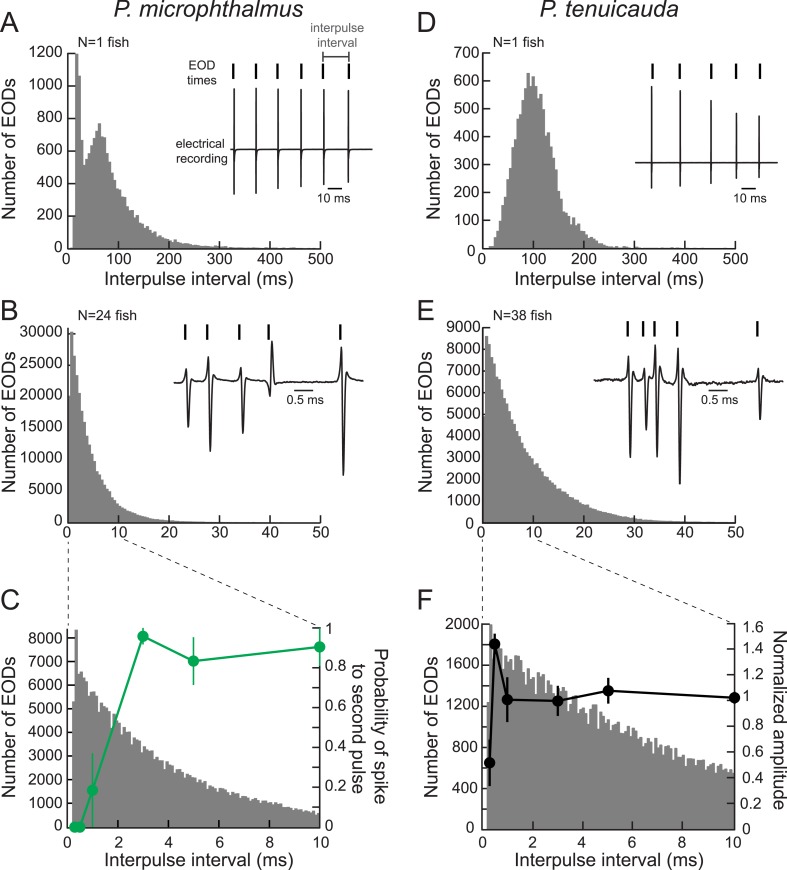
Figure 8. Oscillating receptors are most sensitive to submillisecond IPIs occurring in group communication signals.
(A) A histogram of the IPIs recorded over 20 min from a single fish with spiking receptors (P. microphthalmus). Inset, illustration of IPI calculation. We recorded the electric signaling activity from a single fish and recorded the time of each EOD as the time at which the rectified potential crossed a predefined threshold (tick marks above electrical recording trace). We then calculated IPIs as the time between successive EODs. (B) Same as A for a recording from a group tank of 24 P. microphthalmus. Inset, electrical recording from the same group of fish illustrating submillisecond IPIs. EOD polarity and amplitude depend on fish's orientation and location relative to the recording electrode. (C) Spike probability of three P. microphthalmus receptors (green; y-axis on right; same data as in Figure 5C) vs IPI superimposed on the IPI histogram from B. Note the expanded data range in the x-axis. Each point represents the mean across three receptors and error bars represent S.E.M. (D, E) Same as in A and B for a congeneric species with oscillating receptors (P. tenuicauda). (F) Normalized oscillation amplitudes of three P. tenuicauda receptors (black; y-axis on right; same data as in Figure 6C at 10 nA) vs IPI superimposed on the IPI histogram from E. Note the expanded data range in the x-axis. Each point represents the mean across three receptors and error bars represent S.E.M.

