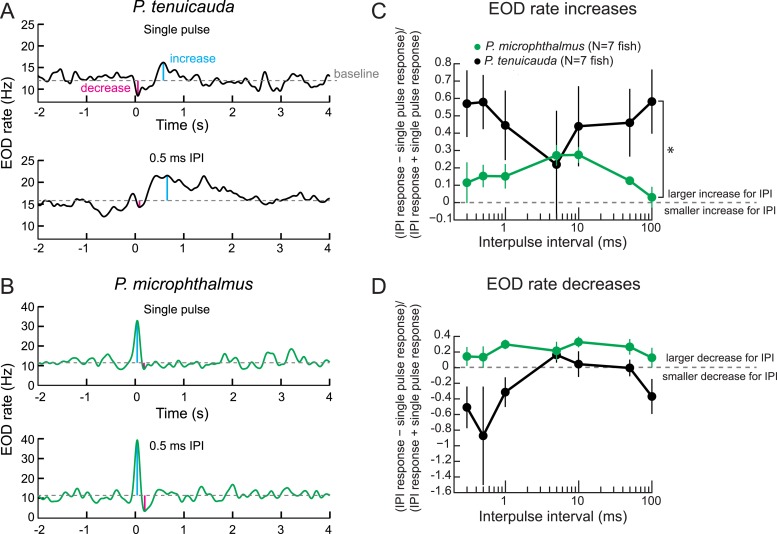
Figure 9. Behavioral responses reveal tuning to submillisecond IPIs in a species with oscillating receptors.
(A) The EOD rate over time in response to a single conspecific EOD (top) and a train of 10 conspecific EODs at constant 0.5-ms IPI in one P. tenuicauda. Stimuli were delivered at time = 0 s. We defined the baseline response as the average EOD rate between 4.8 s and 0.2 s before stimulus onset. We measured the maximum increase and decrease in EOD rate relative to baseline that occurred in a window starting 0.2 s before stimulus onset and ending 1.2 s after stimulus offset. (B) Same as A for one P. microphthalmus. (C) A normalized measure of EOD rate increases to constant IPI trains of conspecific EODs vs IPI during behavioral playback experiments for a species with oscillating receptors (P. tenuicauda) and a congeneric species with spiking receptors (P. microphthalmus). *, repeated-measures ANOVA, interaction between species and IPI, p < 0.01. (D) Same as C for EOD rate decreases. Each point represents the mean across fish and error bars represent S.E.M.

