
Figure 5.
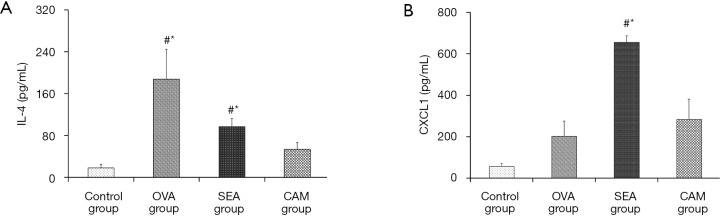
(A) Presented a dramatic difference of IL-4 in OVA group compared to control (#, OVA group vs. control group: 206.27±56.887 vs. 20.44±6.587; P<0.001), while the level of IL-4 in SEA group also higher than control group and CAM group (#, SEA group vs. control group: 109.03±15.474 vs. 20.44±6.587; P=0.017; *, SEA group vs. CAM group: 109.03±15.474 vs. 60.53±11.886; P=0.031); (B) presented a significant elevation of CXCL1 in SEA group compared to that in control group (#, 745.78±72.506 vs. 63.18±12.873; P=0.002); whereas CXCL1 in CAM group decreased significantly in comparison to SEA group (*, 313.419±96.545 vs. 745.78±72.506; P=0.017).