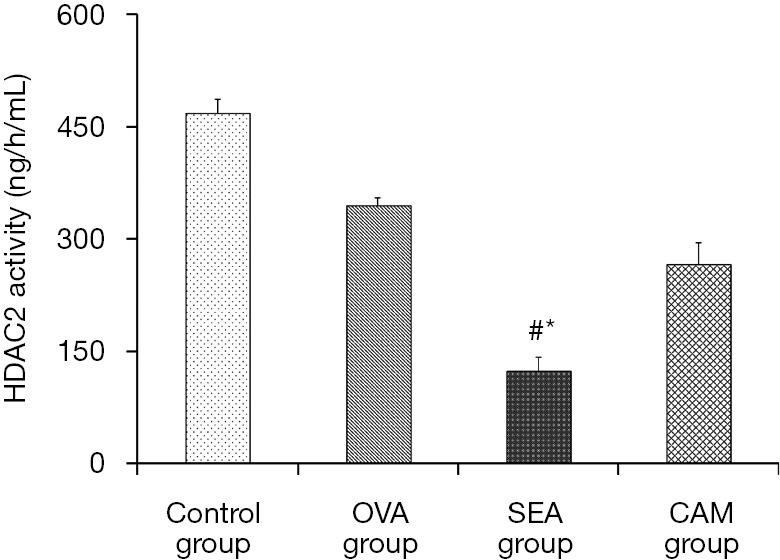
Figure 6.

The graph illustrated that control group possessed the highest HDAC2 activity. HDAC2 activity in SEA group decreased dramatically in comparison to control group (#, 124.44±16.960 vs. 468.56±18.308; P=0.010); while after clarithromycin treatment, HDAC2 activity reversed in CAM group, and was better than that in SEA group, the difference between the two groups was statistically significant (*, 266.89±28.205 vs. 124.44±16.960; P=0.038).
