
Figure 1.
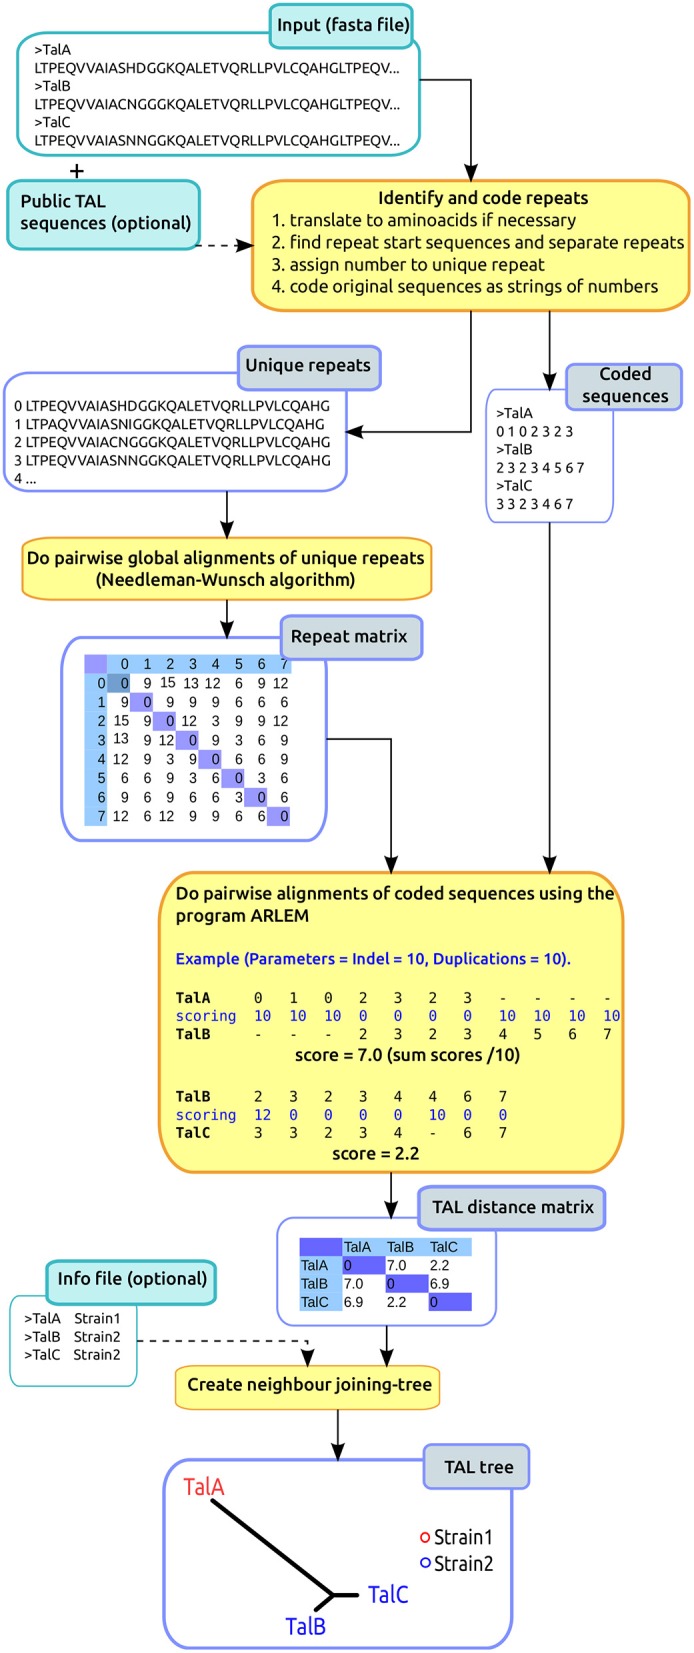
DisTAL workflow. The diagram shows a summarized version of the DisTAL workflow. An example is shown for 3 hypothetical TAL effectors from two strains containing 7–8 repeats each, and 10 unique repeats in total. Processes are shown in the orange squares, inputs (lighter blue) and outputs in blue squares.