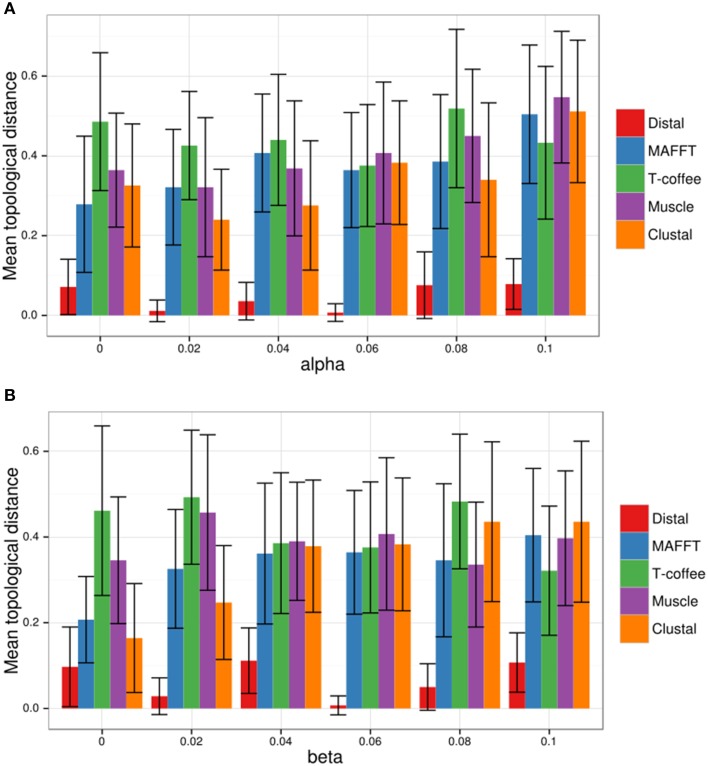
Figure 4.
DisTAL performance with in silico-evolved TAL effectors. Sets of eight TAL effectors (named A–H) resulting from simulated evolution were fed into DisTAL, ClustalW, MAFFT, Muscle and T-coffee, the resulting trees were compared to the expected tree [((A B)(C D))((E F)(G H))], the scatter plot shows the topological distance. (A) Different values of alpha (probability of repeat replacement) were used to generate the sets of TAL effectors while keeping beta (probability of repeat indel) at a value of 0.06. (B) Different values of beta were used to generate the sets of TAL effectors while keeping alpha at a value of 0.06. Each bar represents the average topological distance for 100 sets of TAL effectors, error bars indicate standard deviation.

