
Figure 2.
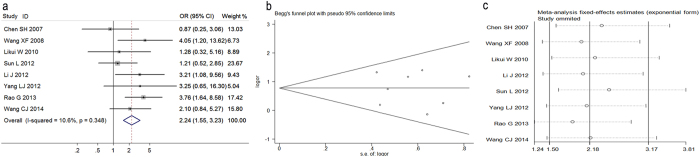
(a) Forest plot for the relationships between Osteopontin (OPN) expression and tumor grades of colorectal cancer. (b) Begg’s funnel plots of publication bias for meta-analysis of OPN. (c) Sensitivity analysis for meta-analysis of OPN.
Official websites use .gov
A
.gov website belongs to an official
government organization in the United States.
Secure .gov websites use HTTPS
A lock (
) or https:// means you've safely
connected to the .gov website. Share sensitive
information only on official, secure websites.
(a) Forest plot for the relationships between Osteopontin (OPN) expression and tumor grades of colorectal cancer. (b) Begg’s funnel plots of publication bias for meta-analysis of OPN. (c) Sensitivity analysis for meta-analysis of OPN.