
Figure 3. Forest plot for the relationships between Osteopontin (OPN) expression and the tumor stage.
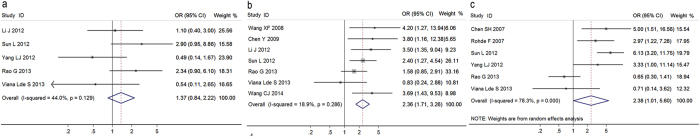
(a) the relationship between OPN expression and the depth of tumor invasion. (b) the relationship between OPN expression and the lymph node metastasis. (c) the relationship between OPN expression and the distant metastasis.