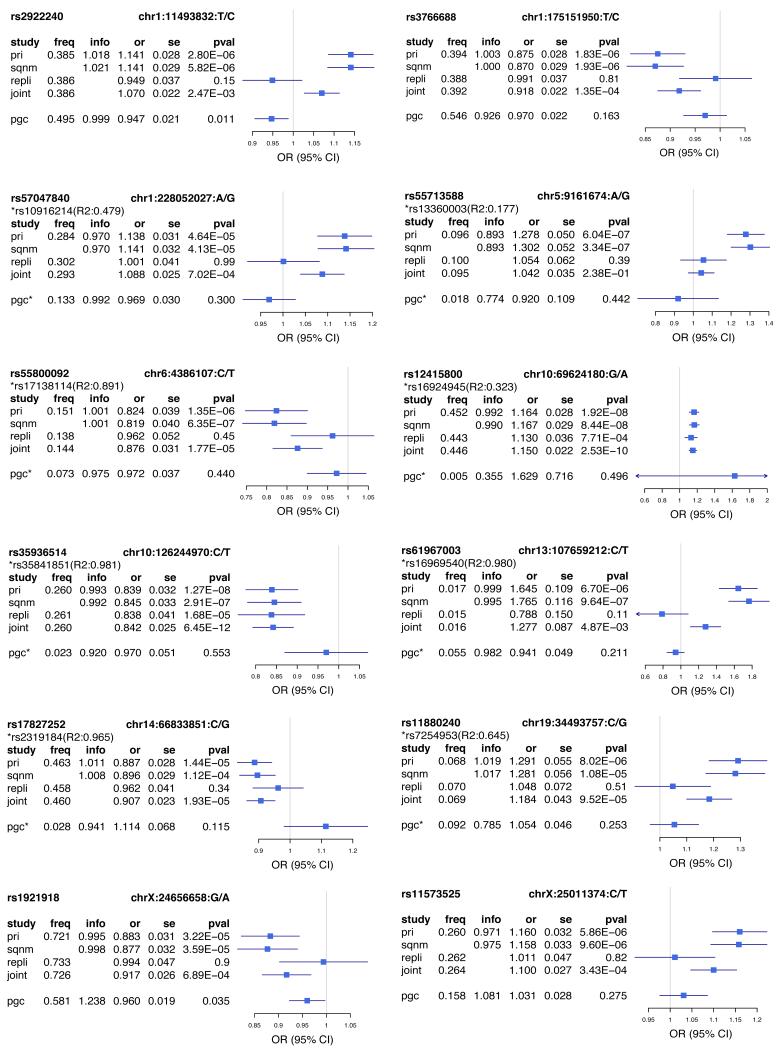
Extended Data Figure 2:
Forest plots of estimated SNP effects in CONVERGE and PGCMDD1 studies.
This figure presents the association odds ratios (OR) at 12 SNPs in CONVERGE and the best available proxy SNPs in PGC MDD (pairwise R2 >0.6, 500kb window; the proxy SNP is marked by “*”). We present the alternative allele frequency (freq), odds ratio (or) with respect to the alternative allele, standard error of odds ratio (se) and P values of association (pval) for the following analyses (study): primary association analysis with a linear-mixed model using imputed allele dosages in 10,640 samples in CONVERGE (pri); validation analysis with logistic regression model with PCs as covariates using genotypes from Sequenom on 9,921 samples in CONVERGE (sqnm); association with MDD with a logistic regression model in replication cohort of 6,417 samples using genotypes from Sequenom (repli); joint association analysis with MDD with a logistic regression model using imputed allele dosages in CONVERGE and genotypes from Sequenom in replication cohort (17,057 samples in total, joint).

