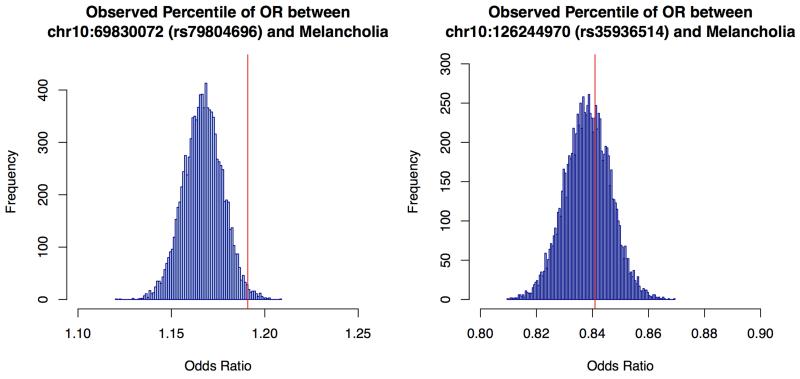
Extended Data Figure 4:
Empirical estimation of the odds ratio increases due to the removal of cases not falling under the diagnostic class of melancholia from an association analysis with major depression.
The figures show the empirical distributions of the odds ratios for association with each of two SNPs (rs79804696, rs35936514), after removing a random set of 796 samples, equal to the number of cases of MDD not diagnosed as being melancholic. The horizontal axis is the odds ratio for each analysis, and the vertical axis the frequency of occurrence of the odds ratio in 10,000 analyses. The vertical red line is the observed odds ratio after removing cases of MDD not diagnosed as melancholic.

