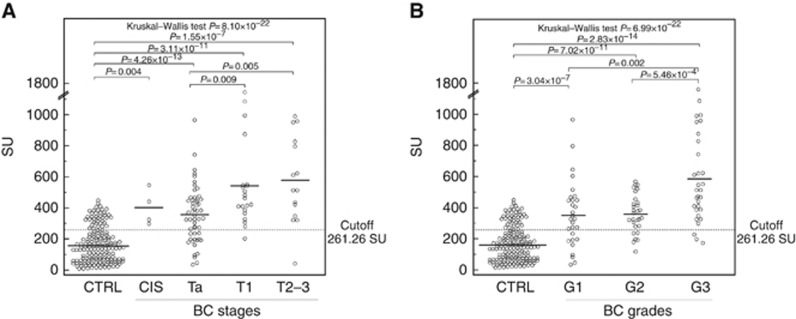
Figure 2.
Urinary tyrosine-phosphorylated protein levels in subjects with different BC stages and grades. (A) Distribution of UPY levels in subjects with different BC stages. Control (CTRL), n=170, mean 157.9±114.5 SU; carcinoma in situ (CIS), n=4, mean 400.8±114.8 SU; Ta, n=53, mean 356.3±181.0 SU; T1, n=20, mean 540.9±346.6 SU; and T2–3, n=15, mean 579.5±290.6 SU. Urinary tyrosine-phosphorylated protein levels are significantly different in groups of BC patients with different BC stages (Kruskal–Wallis test, P=8.10 × 10⁻²²). (B) Distribution of UPY levels in subjects with different BC grades. Control, n=170, mean 157.9±114.5 SU; G1, n=29, mean 357.6±217.9 SU; G2, n=29, mean 361.7±122.9 SU; and G3, n=30, mean 584.5±336.4 SU. Urinary tyrosine-phosphorylated protein levels are significantly different in groups of BC patients with different BC grades (Kruskal–Wallis test, P=6.99 × 10⁻²²). The solid lines indicate the mean values; the dotted line indicates the best cutoff value.

