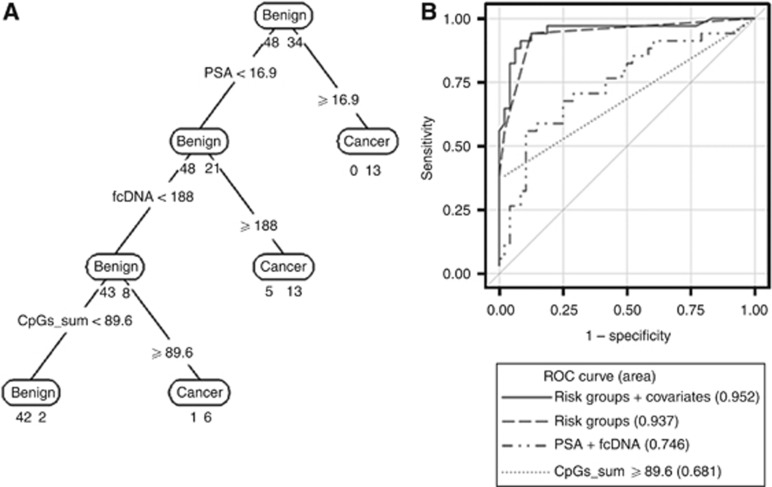
Figure 3.
(A) Classification tree based on cut points for PSA, fcDNA and sum of GADD45a four-CpG methylation (CpGs_sum). Age, race and ethnicity were also included in each model statement under RPART but none defined partition. Below each prediction node label (corresponding to majority vote) is shown the number of observations from benign and cancer groups, respectively. The corresponding misclassification rates were 8/82 (9.8%) overall, 6/48 (12.5%) in benign and 2/34 (5.9%) in cancer group. These implied specificity 42/48 (87.5%) and sensitivity 32/34 (94.1%). In addition, the leave-one-out cross-validation misclassification error was 9.9%. (B) Receiver-operating curves for comparison of the classification tree models including PSA, fcDNA and GADD45a methylation (solid and dashed lines) to other fitted models.

