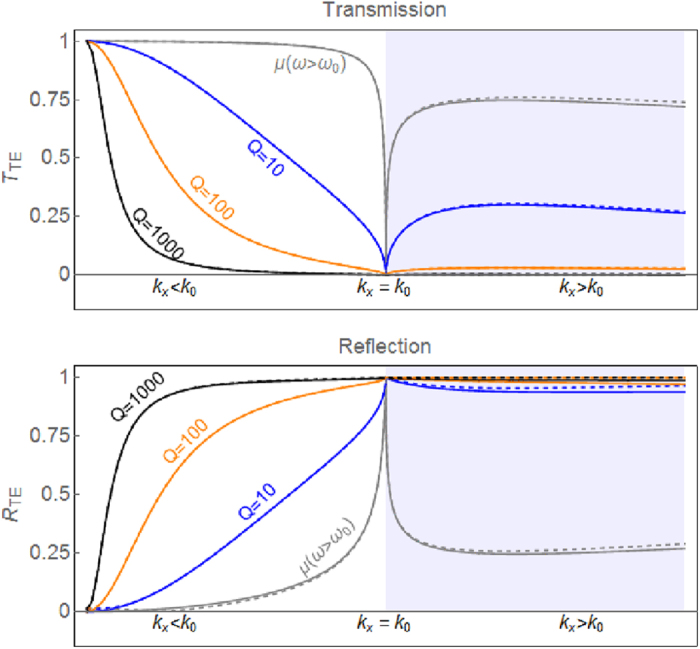
Figure 2. T and R of a LMNZ layer.

The TE transmission (top) and reflection (bottom) coefficients (Eq. 1) are plotted as a function of kx for a LMNZ layer (solid lines) and an isotropic layer with μx = μz (dashed lines). At frequencies away from the ω = ω0 point, transmission is high (gray curve). When  , transmission is significantly reduced (and reflection enhanced), with larger attenuation for larger Q values. The LMNZ layer reflects almost as well as the isotropic layer. The layer thickness here is assumed to be λ/250, and the shaded region corresponds to kx > k0, where the angle of incidence is imaginary.
