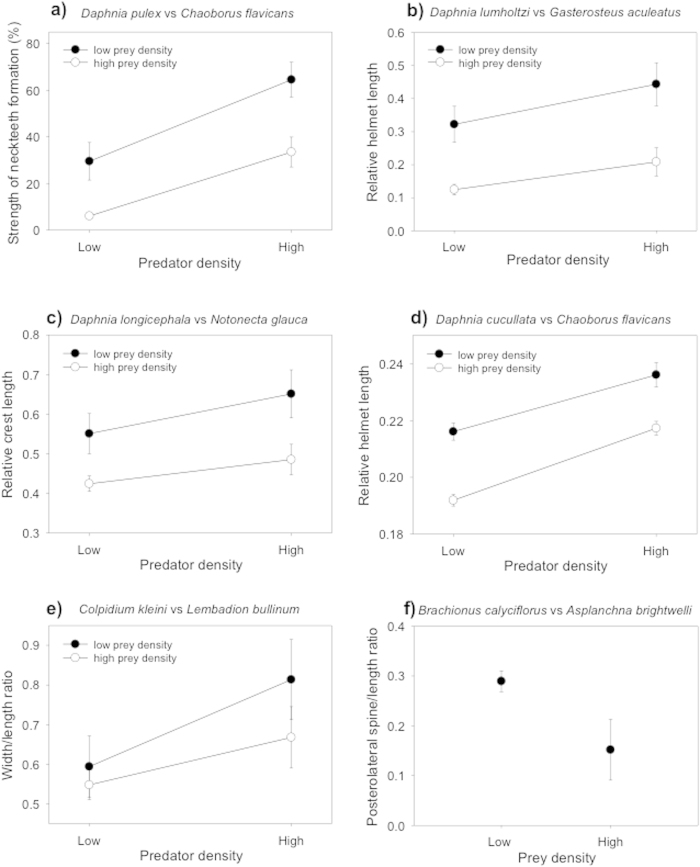
Figure 1. Expression of inducible defenses increases with predator density (kairomone concentration) and decreases with prey density.
The plots show treatment means ± SD of relative defense expression (trait value divided by body length) or, in Daphnia pulex, of a score of neckteeth formation. Two-way ANOVA results are significant for predator and prey effects in all systems (all p ≤ 0.001). In the Brachionus calyciflorus system, the prey density effect was tested only at a single predator density and analyzed with a Mann-Whitney U-test (p = 0.023).

