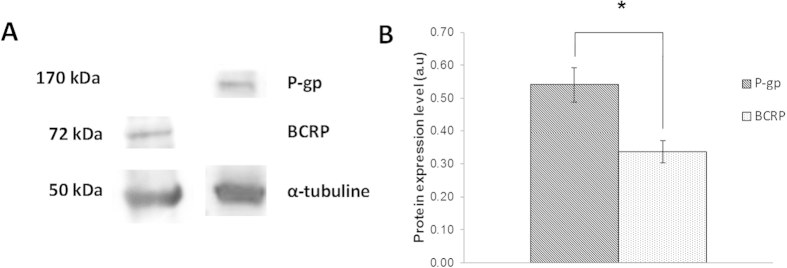
Figure 1. Basal coexpression of BCRP and P-gp in SUM1315 cell line.

(A) P-gp and BCRP expression were analyzed using Western blot analysis. P-gp and BCRP weighed 170 kDa and 72 kDa, respectively. α-tubulin was used as internal control and presented a molecular weight of about 50 kDa. The full-length blot is presented in Supplementary Fig. S1. (B) P-gp and BCRP expression level was quantified using QuantityOne software (Biorad®). Statistical analyses were performed by student’s t test. *indicates a significant difference (p < 0.05) in P-gp and BCRP expression.
