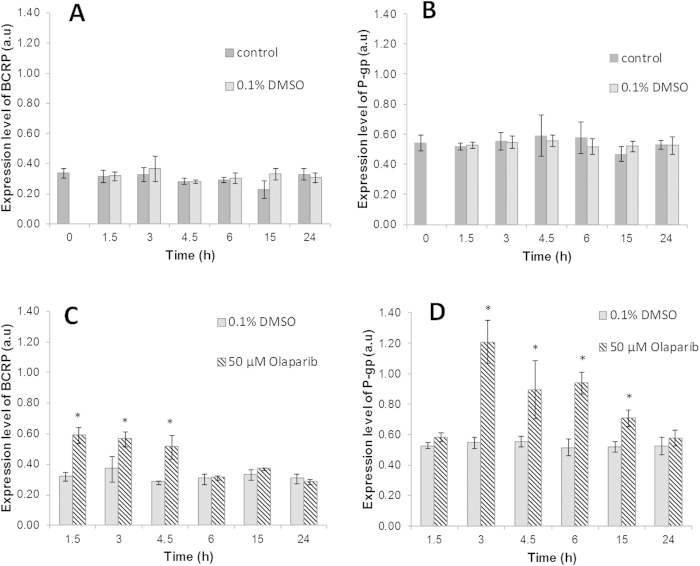
Figure 3. P-gp and BCRP coexpression induction in SUM1315 cell line in the presence of Olaparib.
P-gp and BCRP expression levels were analyzed in total protein extract from SUM1315 cells using Western blot analysis. Protein expression was quantified using QuantityOne software (Biorad®). (A) Expression level of BCRP in untreated cells and cells treated with 0.1% DMSO. (B) Expression level of P-gp in untreated cells and cells treated with 0.1% DMSO. (C) Expression level of BCRP in 0.1% DMSO control cells and in cells treated with 50 μM Olaparib. (D) Expression level of P-gp in 0.1% DMSO control cells and in cells treated with 50 μM Olaparib. Statistical analyses were performed by student’s t test. *indicate a significant difference (p < 0.05) in BCRP or P-gp expression between control 0.1% DMSO and Olaparib treated cells.

