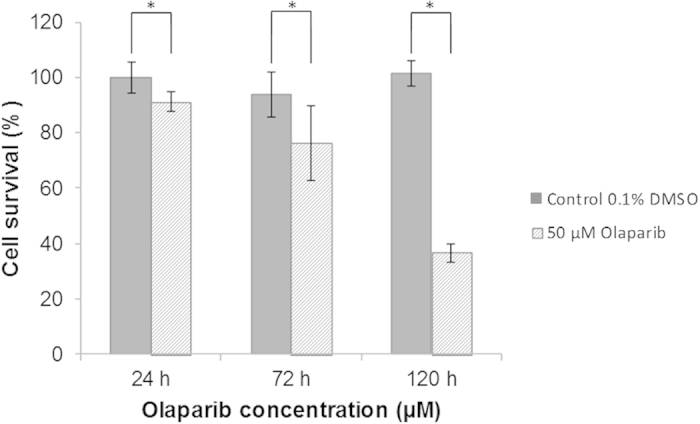
Figure 5. Cell survival rate of SUM1315 cell line in presence of 50 μM Olaparib over time.

SUM1315 cells were treated with 50 μM Olaparib and the cell viability was analyzed with the SRB cell viability assay after 24, 72 and 120 h of treatment. Statistical analyses were performed by student’s t test. *indicate a significant difference (p < 0.05) in cells survival between controls and treated cells.
