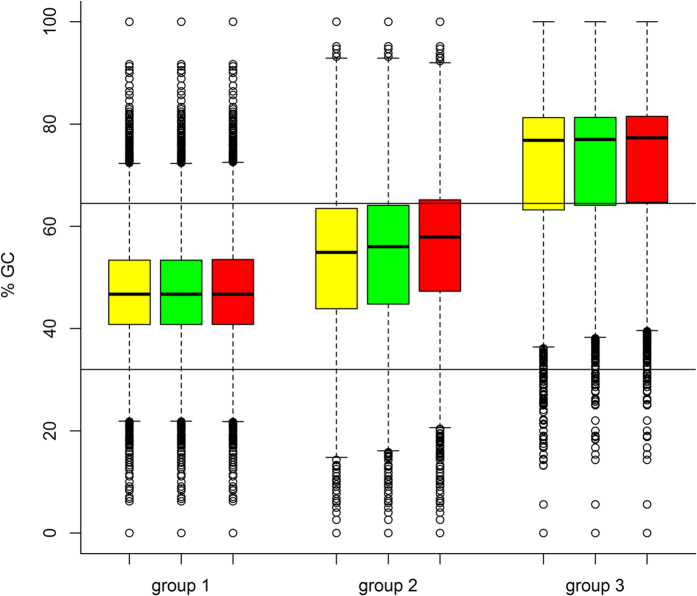
Figure 2. Comparison of the GC content per region (% GC) for the completely covered regions with a minimum sequencing depth of 5x (=group 1), the regions with a varying sequencing depth (=group 2) and the regions with a maximum sequencing depth of 4x (=group 3).
Each box represents the 25th (Q1), median (Q2) and the 75th (Q3) quartile, the whiskers represent 1.5 times the interquartile range (Q3–Q1). Outliers are represented as circles. Vertical lines represent the cutoffs at 32.0% GC and 64.5% GC. The yellow boxes represent the values for all the regions in a group. The green boxes represent the values for the remaining regions after exclusion of the regions that Roche Nimblegen predicted to not being sequenced. The red boxes represent the values for the remaining regions after exclusion of all the regions with repeats and Ns.

