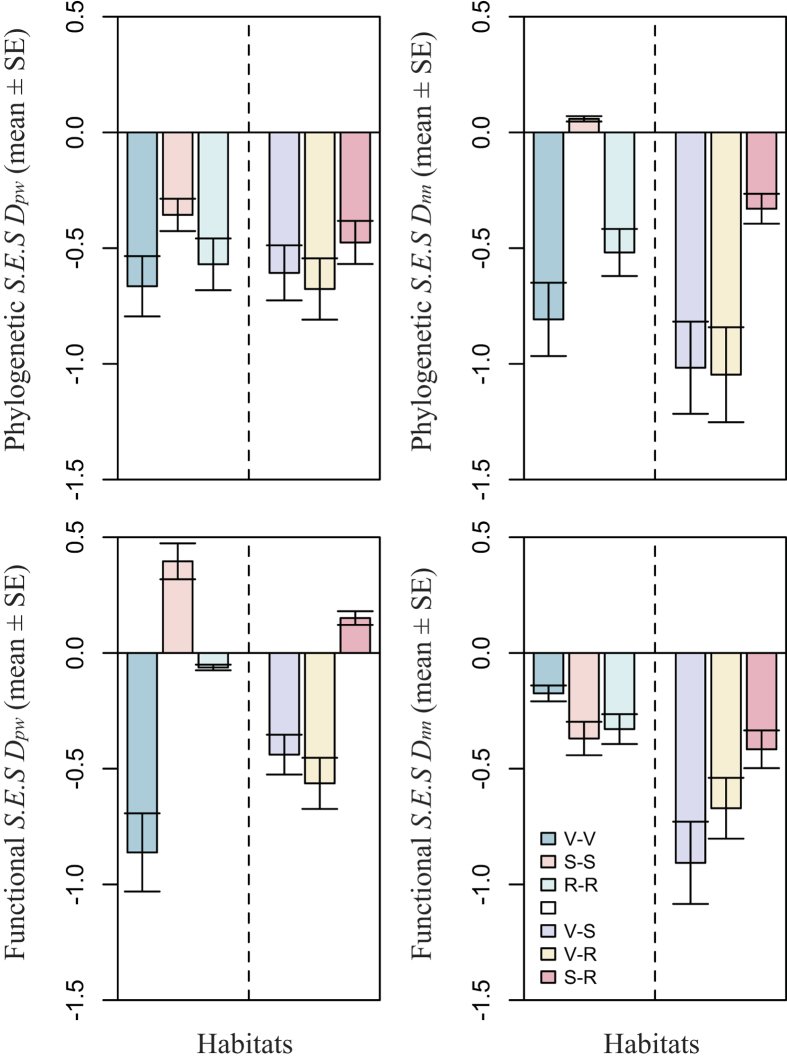
Figure 3. Bar charts illustrating phylogenetic and functional dissimilarity between subplot (20 m × 20 m) pairs both within habitats and across habitats.
V: Valley; S: Slope; R: Ridge. The same letters represent phylogenetic and functional dissimilarity within habitats (i.e. V-V, S-S, R-R) and the different letters represent that across habitats (i.e. V-S, V-R, S-R).

