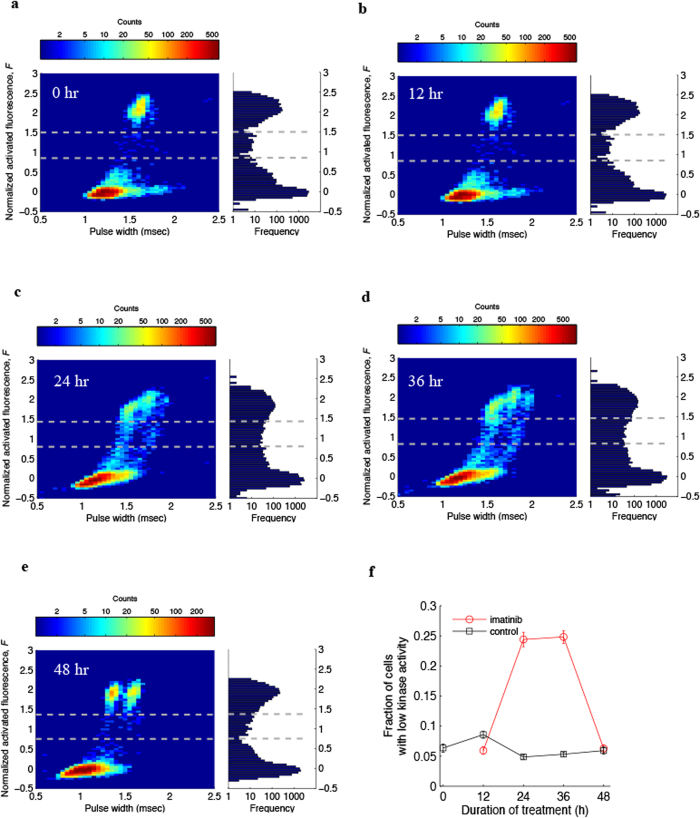
Figure 2. Monitoring kinase activity of drug-treated single leukemia cells using drop-based PAIGE.
(a–e) Heat maps showing the distribution of drops containing K562 cells treated with imatinib for 0, 12, 24, 36 and 48 hours (left). The corresponding fluorescence histograms are shown on the right. The dash lines separate three groups of drops: bright and low-fluorescence drops containing cells that express high and low kinase activities, respectively, and dark drops without cells. (f) Fractions of cells with low kinase activity as determined by drop-based PAIGE during the treatment of imatinib (red circle) or DMSO (black square) as control.

