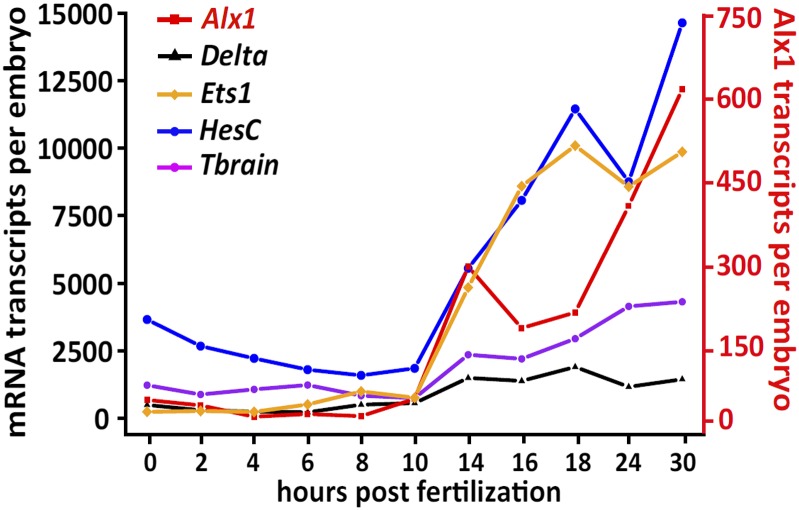
Fig. S1.
Time course of mRNA expression of Sp double-negative gate genes in this study. The left ordinate shows the estimated number of transcripts per embryo as determined by QPCR for delta, ets1, hesC, and tbrain. The right ordinate (shown in red) is estimated transcripts per embryo for alx1 only. The x axis shows the time points in development assayed, starting at fertilized egg (0 hpf) and ending when skeletogenic mesenchyme ingresses at early gastrula stage (30 hpf). A protocol for estimating the number of transcripts per embryo is described in SI Materials and Methods.

