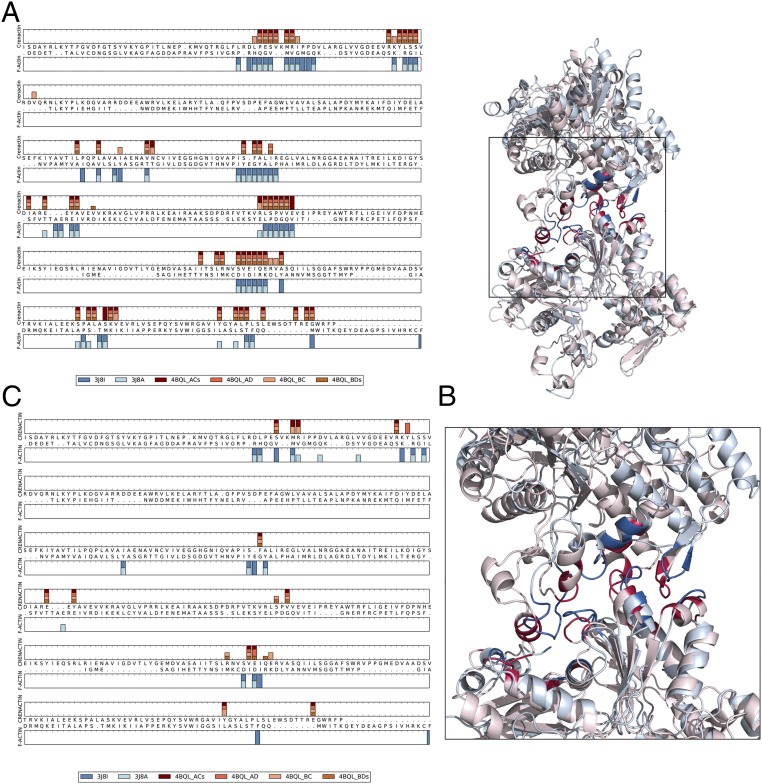
Fig. 3.
Similarity of F-actin and crenactin interfaces. (A) Interfacial residues for the four different crenactin interfaces present in 4BQL and the two actin structures (blue) are mapped onto the structural alignment between actin and crenactin 4BQL_BDs (generated using the DaliLite webserver). Residues were defined as being part of the interface if they were within 8 Å (Cβ–Cβ distance) of a residue in the neighboring subunit. (B) The ribbon diagram for actin (3J8I) is shown in light blue, and crenactin (4BQL_BDs) is in light red. The interfacial residues identified in A are shown in dark blue for actin and dark red for crenactin. (C) Hot spots determined with computational alanine scanning for the four different crenactin interfaces present in 4BQL and the two actin structures are mapped onto the structural alignment between actin and crenactin. Hot spots are defined as residues having a change in binding energy ≥1 kcal/mol.

