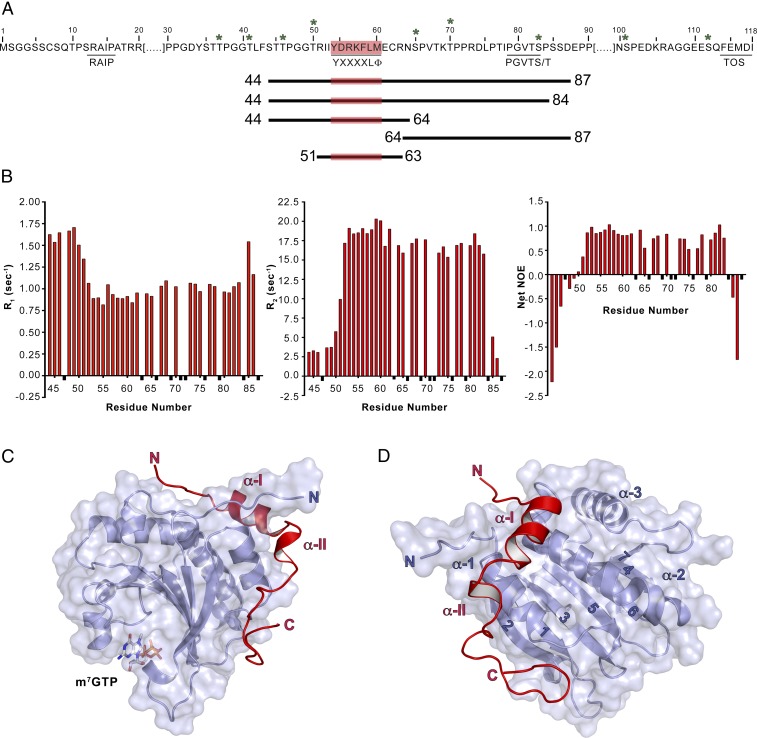
Fig. 1.
eIF4E/m7GTP/4E-BP1 complex. (A) Sequence of 4E-BP1. Relevant motifs (underlined), phosphorylation sites (stars), and constructs used in this study (lines of different length) are indicated. (B) 4E-BP1 flexibility probed by relaxation studies. R1 (Left), R2 (Middle), and heteronuclear NOE (Right) data are shown for a sample of 400 μM 13C,15N-4E-BP144–87 bound to eIF4E/m7GTP in 95:5 H2O/D2O at pH 6.5. Data points corresponding to unassigned residues or residues that could not be measured are shown in black and given an arbitrary negative value. (C) Ribbon diagram (side view) of eIF4E33–217/m7GTP/4E-BP150–84. eIF4E and 4E-BP1 are shown in blue and red, respectively. (D) Ribbon diagram of the complex described in C, but showing a dorsal view of the complex.

