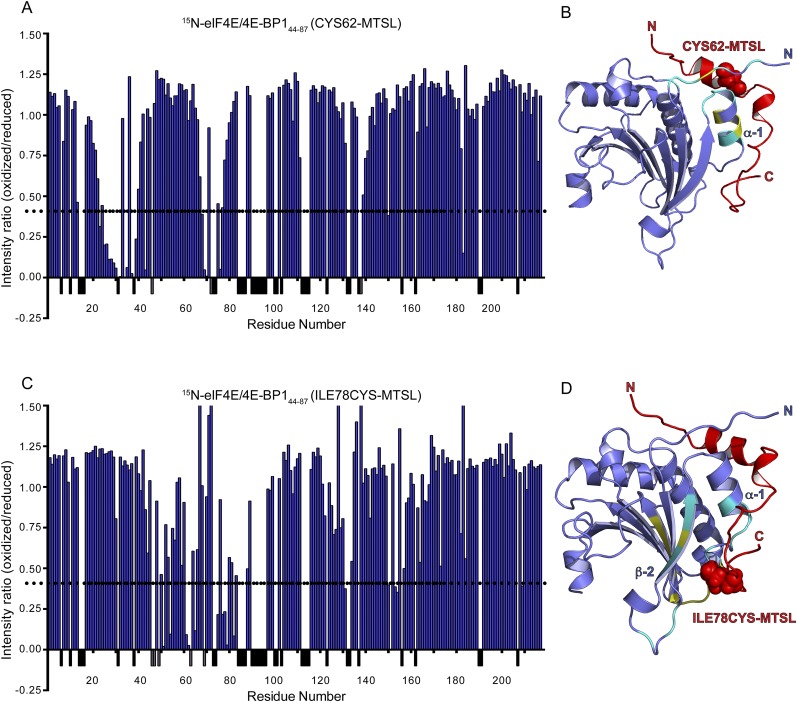
Fig. S4.
Paramagnetic relaxation enhancement experiments. (A and C) Ratio of the intensities (Ioxidized/Ireduced) of eIF4E/m7GTP amide resonances monitored by 15N-1H-TROSY-HSQC bound to 4E-BP144–87. 4E-BP1 contains either an oxidized or a reduced form of MTSL spin label attached at position 62 or at position 78. A dashed line represents a 60% decrease in intensity. (B and D) Ribbon diagram of eIF4E/m7GTP/4E-BP1 crystallographic structure, where residues with more than 60% reduction in intensity are shown in cyan. Unassigned eIF4E residues located within an area affected by the presence of the MTSL (red dot spheres) are highlighted in yellow.

