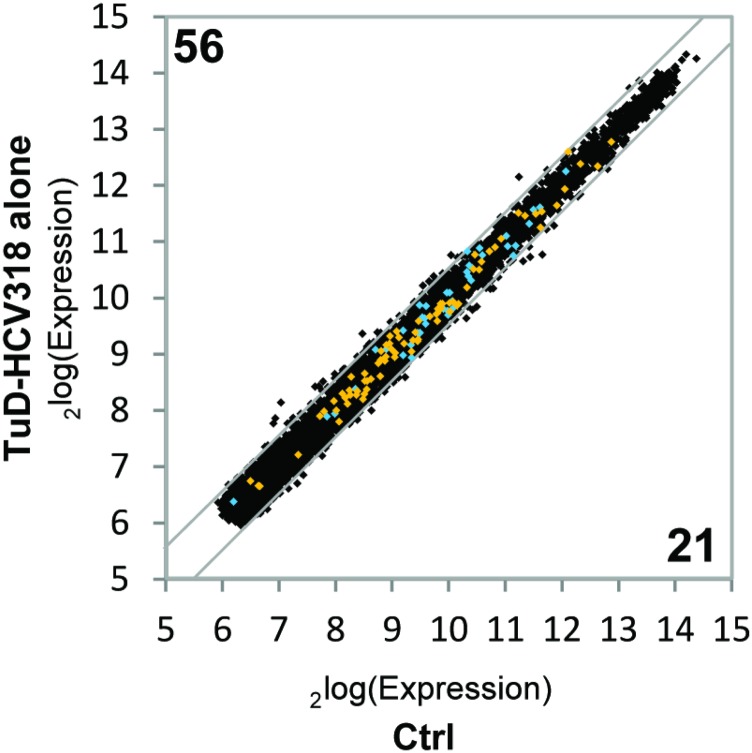
Fig. S6.
Expression of the TuD-HCV318 alone does not affect group 1 and group 2 genes. Absolute gene expression levels from cDNA microarray analysis in scAAV2-transduced Huh7 cells (MOI 105) expressing TuD-HCV318 were plotted versus Huh7 cells expressing neither shRNA nor TuD. Numbers indicate genes that are significantly different between samples. P < 0.01, two-sided t-test; fold-change cutoff at log2(0.5). The genes from group 1 (blue) and group 2 (orange) in Fig. 4 A–C are highlighted. Overall gene-expression changes are mild, and, importantly, none of the group 1 or group 2 genes is significantly dysregulated by TuD-HCV318 alone.

