Fig. 4.

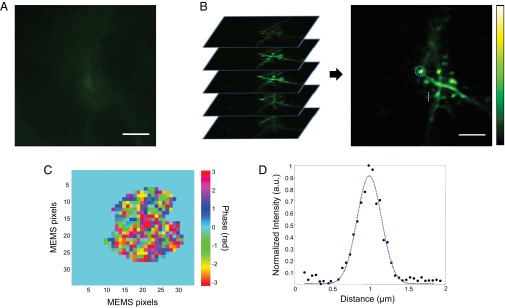
In vivo imaging of dendritic spines through the intact skull. (A) Maximum-intensity projection (MIP) of the volume stack obtained with system correction. Neurons at the superficial layer of the brain were imaged through 150 µm of intact skull. (B) MIP of the volume imaged with wavefront correction after 3D deconvolution. We merged 20 z-stacks with 1-µm axial spacing for the MIP. Submicron-sized spine neck and head structures can clearly be identified. The blue dotted circle denotes the laser beam position during wavefront measurement. A and B share the same color bar and were acquired with the same laser power. (Scale bars: 5 µm.) (C) Wavefront correction profile. (D) Plot along the white dotted line in B (averaged over six neighboring lines), passing through a spine neck. The blue dotted line shows the Gaussian fit with FWHM of 400 ± 30 nm. An original image before deconvolution is provided in Fig. S3.
