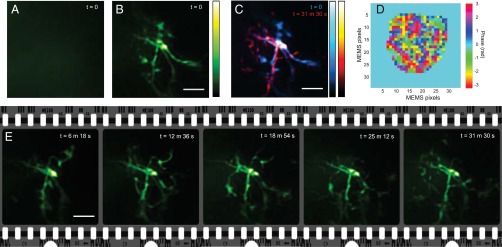
Fig. 5.

Time-lapse imaging of microglia in its resting state. (A) MIP of the image recorded with system correction. Wavefront distortions through the skull blurred out all information, resulting in a haze. (B) MIP recorded for the same FOV with wavefront correction at the initial state (defined as t = 0). We imaged microglia 180 µm from the skull surface through the 150-µm-thick skull. (C) MIPs of image volumes recorded at t = 0 and t = 31.5 min merged in cyan and red, respectively. Active morphology changes can be clearly seen. The long-term observation also demonstrates the stability of the wavefront compensation. (D) Correction wavefront profile used for all images obtained during the time-lapse imaging. (E) Time trace of the spontaneous microglia dynamics. MIPs are shown for consecutive time frames. The 3D-rendered movie is provided as Movie S1. All MIPs have been 3D-deconvolved. (Scale bars: 5 µm.)
