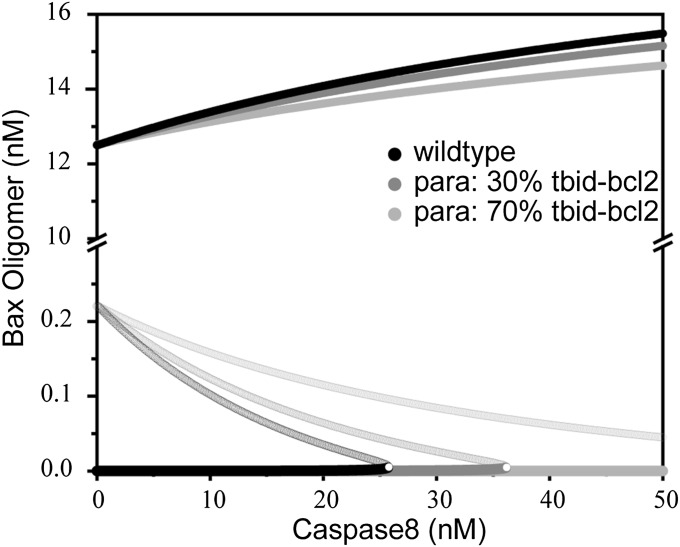
Fig. 2.
Bifurcation diagram for Bax oligomer in MOMP induction. Bifurcation diagram for Bax oligomers using the caspase8 concentration as the control parameter. Solid circles indicate the stable steady state; open circles indicate the unstable state. Reducing the parameter tBid-Bcl2 shifts the bifurcation point to the right, indicating an increasing MOMP threshold. Black, without tBid-Bcl2 decrease; dark gray, tBid-Bcl2 decreased by 30%; light gray, tBid-bcl2 decreased by 70%.

