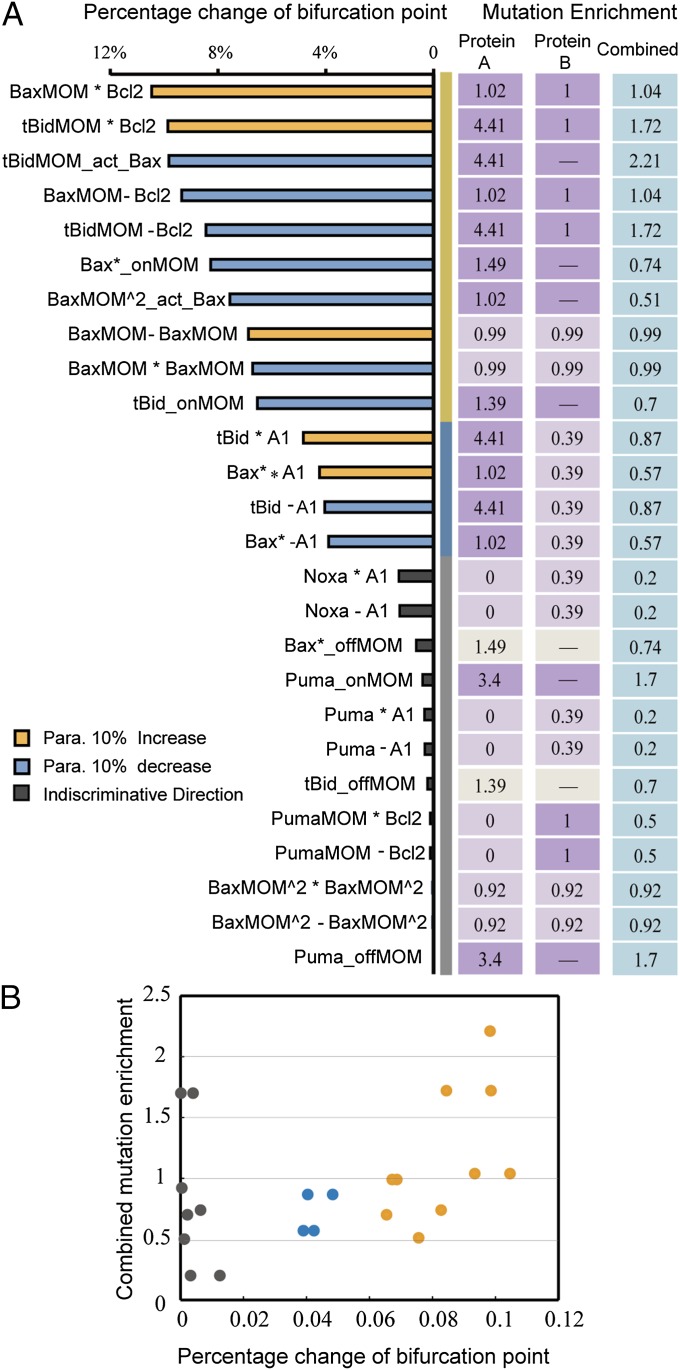
Fig. 4.
Comparison between subset parameter sensitivities and mutation enrichment for each functional domain. (A) Comparison between subset parameter sensitivities and mutation enrichment. Different sensitivity groups are separated by yellow, blue, and gray stripes, with the same criteria as those of Fig. 3A. Bar colors indicate perturbation direction for each parameter. Corresponding interactions for each parameter are labeled. Cancer-related mutation enrichment for each corresponding functional domain is aligned to the corresponding parameters. Protein A, first protein in the interaction; Protein B, second protein in the interaction; Combined, combined mutation enrichment for corresponding interation. Enrichments for interactions only involving one protein are marked by a dash in the Protein B panel. Dark purple, E ≥ 1; light purple, E < 1; ivory, inconsistent sensitivity between the membrane translocation parameter and the membrane separation parameter. (B) Two-dimensional scatter plot of subset parameter sensitivity and combined mutation enrichment. Dot colors indicate different sensitivity groups.

