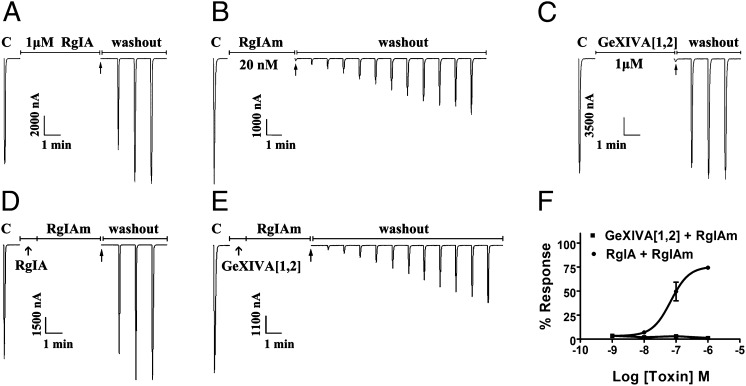
Fig. 3.
Binding site comparison of αO-GeXIVA and α-conotoxin RgIAm. In each instance, toxin solution was applied to α9α10 nAChRs expressed in Xenopus oocytes, followed by toxin washout. The response to 1-s pulses to ACh were measured as described in Materials and Methods. (A) One micromolar α-conotoxin RgIA for 5 min. Note the rapid recovery following toxin washout. (B) Twenty nanomolar α-conotoxin RgIAm for 4 min. Note the slow recovery. (C) One micromolar αO-conotoxin GeXIVA[1,2] for 5 min. Note the rapid recovery. (D) One micromolar α-conotoxin RgIA for 1 min, followed by 20 nM α-conotoxin RgIAm for 4 min. Note that preblockade of α9α10 nAChR with α-conotoxin RgIA prevented the slowly reversible block associated with α-conotoxin RgIAm, consistent with competitive binding to the same or overlapping site. (E) One micromolar αO-GeXIVA[1,2] for 1 min, followed by 20 nM α-conotoxin RgIAm for 4 min. Note that preblockade of α9α10 nAChR with αO-GeXIVA[1,2] did not prevent the very slowly reversible block associated with α-conotoxin RgIAm, consistent with occupancy of distinct binding sites. (F) Oocytes expressing α9α10 nAChRs were preincubated with varying concentrations of RgIA for 5 min. This step was followed by coincubation with RgIA + 20 nM RgIAm for a further 5 min. Both toxins were then washed out, and the response was measured following 2 min of washout. Note that an increasing concentration of RgIA led to a greater percent response (faster recovery) to ACh. Oocytes expressing α9α10 nAChRs were preincubated with varying concentrations of GeXIVA[1,2] for 5 min. This step was followed by coincubation with GeXIVA[1,2] + 20 nM RgIAm for a further 5 min. Both toxins were then washed out, and the response was measured following 2 min of washout. Note that an increasing concentration of GeXIVA[1,2] had no effect on percent response to ACh (n = 5–6 oocytes).

