Fig. 4.
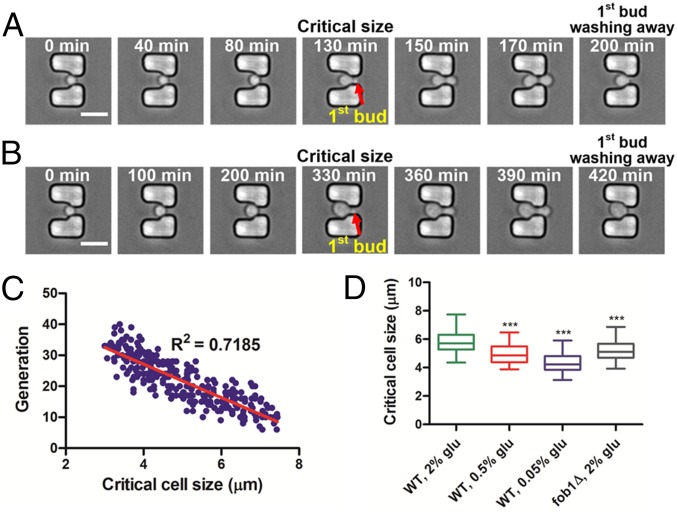
Critical cell size can be a marker for longevity in the budding yeast. (A and B) Time-course images of a cell show growth to the critical size for initiation of budding. Times given in each image indicate the culture duration of the trapped mother cell. The cell began dividing with a (A) relatively smaller critical size, resulting in a relatively longer lifespan of 23 generations. When the cell began dividing with a (B) relatively larger critical size, the lifespan was shorter, consisting of only eight generations. (Scale bar: 10 μm.) (C) Correlation between the critical cell size and lifespan. The red line indicates a linear regression of the correlation (n = 270, R2 = 0.7185). (D) Critical cell size of WT strain grown in 2, 0.5, and 0.05% (wt/vol) glucose in SC media and the fob1Δ strain grown in 2% (wt/vol) glucose. Average critical cell sizes: WT 2% (wt/vol) glucose, 5.85 μm (n = 215); WT 0.5% glucose, 4.96 μm (n = 220); WT 0.05% glucose, 4.39 μm (n = 237); fob1Δ 2% (wt/vol) glucose, 5.17 μm (n = 232). Asterisks indicate statistically significant differences (P < 0.0001) compared with WT grown in 2% (wt/vol) glucose in SC medium. Detailed statistical data are shown in Table S3.

