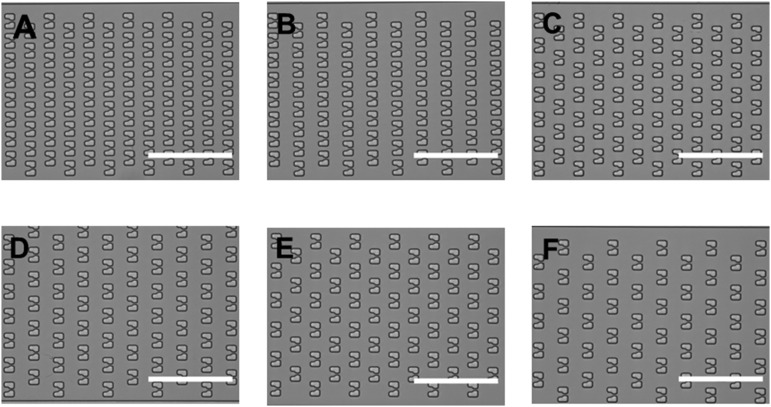
Fig. S3.
Images of different trap arrays using different column and row spacing in the HYAA-Chip. The spacing shown is as follows: (A) 6-μm column and 12-μm row; (B) 6-μm column and 18-μm row; (C) 12-μm column and 12-μm row; (D) 12-μm column and 18-μm row; (E) 18-μm column and 12-μm row; and (F) 18-μm column and 18-μm row. (Scale bars: 100 μm.)

