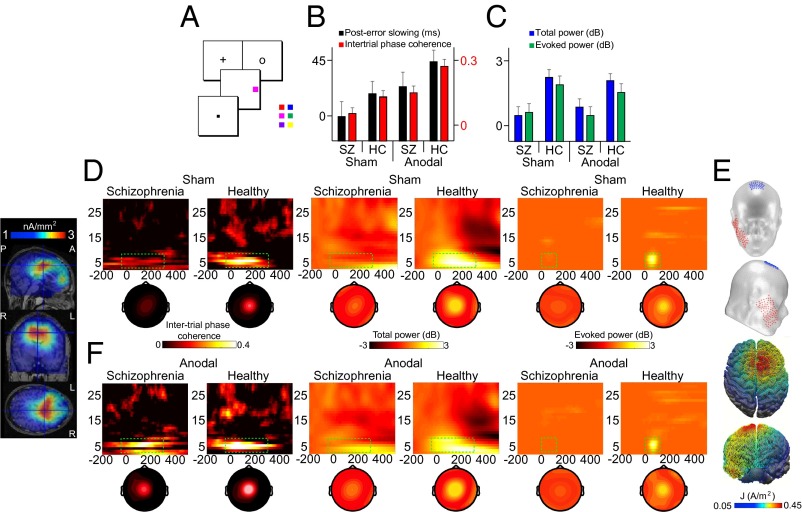
Fig. 1.
tDCS model, task, and the behavioral and spectral signatures of adaptive control. (A) Target discrimination task requiring subjects to report the color of the target (red vs. blue, magenta vs. green, or purple vs. yellow) by pressing one of two buttons on a handheld gamepad. (B) Mean posterror RT slowing and mean intertrial phase coherence shown across stimulation conditions and subject groups. HC, healthy controls; SZ, patients with schizophrenia. (C) Mean total power and mean evoked power as in B. (D) Intertrial phase coherence (Left), total power (Middle), and evoked power (Right) at Cz on error minus correct trials shown across subject groups in the sham condition. Topographies show spatial distribution from the selected time-frequency measurement windows (green rectangles). (Far Left) Source estimate of intertrial phase coherence centered on Cz peak activity for healthy subjects in the sham condition is shown across sagittal, coronal, and axial MRI slices. A, anterior; L, left; P, posterior; R, right. (E) Schematic of tDCS montage and the modeled distribution of current during active tDCS on top and front views of a 3D reconstruction of the cortical surface. (F) Response-related time-frequency representations and topographies as in D shown across subject groups in the anodal tDCS condition. The analytical window for intertrial phase coherence and total power analyses was 4–8 Hz, −50 to 300 ms periresponse. The analytical window for evoked power analyses was 4–8 Hz, 0–100 ms postresponse. Data were scalp Laplacian-transformed.

