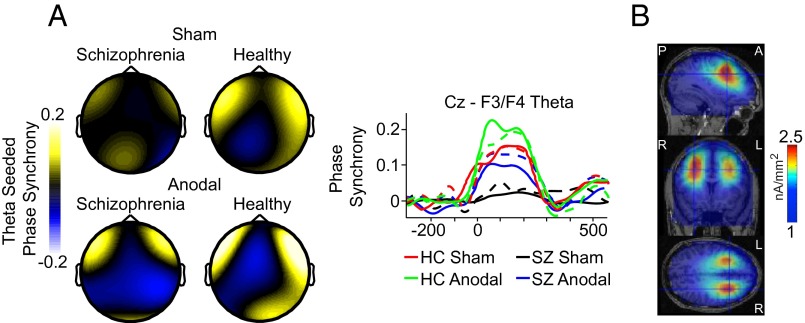
Fig. 3.
Interregional phase synchrony. (A) Topographical maps of Cz-seeded theta phase synchrony at peak values between −50 and 300 ms after errors relative to correct responses shown across stimulation conditions and subject groups. Waveforms show the time course of the response-locked theta phase synchrony for Cz-F3 (dashed lines) and Cz-F4 (solid lines) electrode pairs across conditions and subject groups. (B) Source estimation of the peak theta phase synchrony, from –50 to 300-ms periresponse on error minus correct trials from the sham condition of healthy subjects shown across sagittal, coronal, and axial MRI slices. Data were scalp Laplacian-transformed.

