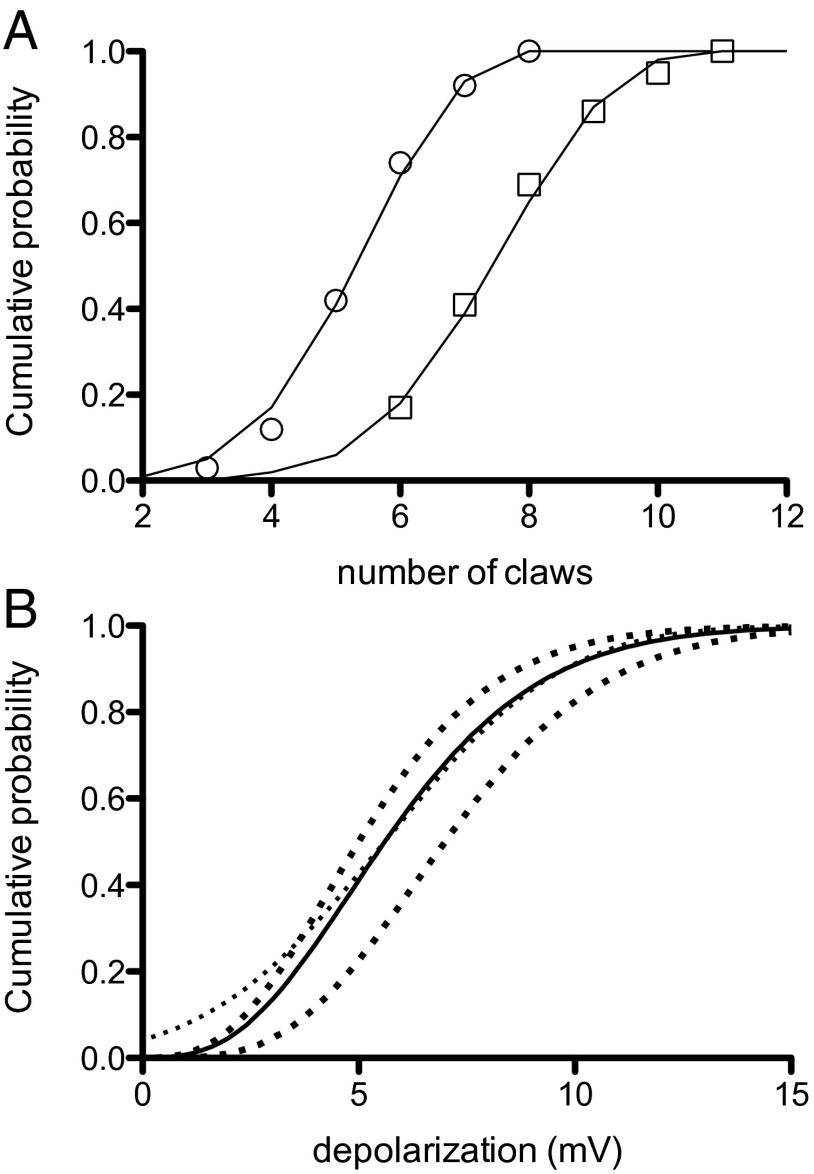
Fig. 3.
Probability distributions for Kenyon cell claw number and its effect on the depolarization of Kenyon cells by projection neurons. (A) Graphs for cumulative probability of claw number (non-γ Kenyon cell Left, γ type Right). The smooth curves are binomial distributions. (B) Calculated probability distribution for depolarization of Kenyon cells by antennal lobe input (solid curve), a normal probability distribution (light dotted). The heavy dotted curves to the left of the solid curve is the distribution for non-γ Kenyon cells (Left), and for γ Kenyon cells (Right).

