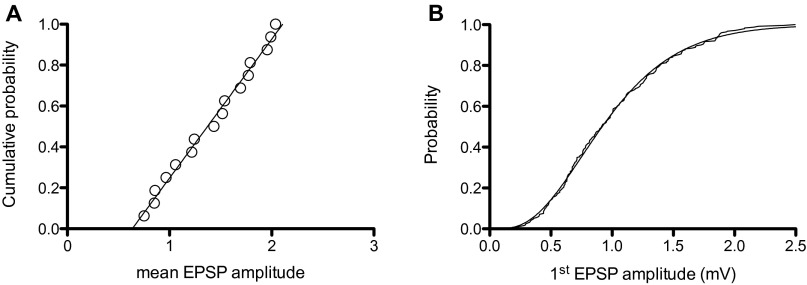
Fig. S2.
Properties of the antennal lobe projection neuron synapses onto KCs. (A) The cumulative distribution function for synaptic strength at 16 single claw synapses [the mean amplitude (mV) for the first EPSP]. The fitted straight line has a slope of 0.85 (B). Cumulative histogram for all EPSP amplitudes (235 observations) scaled for each claw to have a mean = 1. This histogram has been fitted to a Γ distribution function with scale factor = 4 and shape factor = 4.

