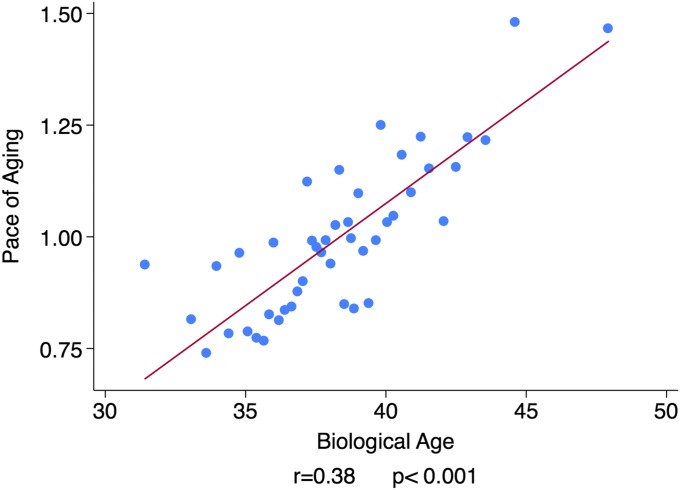
Fig. 4.
Dunedin Study members with older Biological Age at 38 y exhibited an accelerated Pace of Aging from age 26–38 y. The figure shows a binned scatterplot and regression line. Plotted points show means for bins of data from 20 Dunedin Study members. Effect size and regression line were calculated from the raw data.

